ECB and FED sealed EUR/USD's fate
2015 has been indeed the year of the Central Banks, particularly when referring to the EUR/USD pair. It was right at the beginning of the year when both Central Banks' leaders promised measures in completely opposite directions: the US Federal Reserve ended its facilities programs in October 2014 and began then announcing a "back to normal" run that was finally fulfilled in December with a rate hike of 25bp.The ECB on the other hand did the "whatever it takes" promised by Draghi back in 2012 and announced a €1.1 trillion quantitative easing program at the beginning of this year, expanding it softly also in December.
The EUR/USD pair started the year at 1.2101 and closed it at 1.1280. The bearish momentum in the pair extended down to 1.0461, and reversed course when the FED failed to pull the trigger in April, as initially expected. Ever since, the pair lacked directional strength until October, when it resumed its decline following the latest announcements of both Central Banks: US Yellen promised a rate hike before the year end, whilst EU Draghi said he was ready to raise the bet, and extend QE.
Both did as promised early December, yet the pair advanced afterwards, pointing for a positive monthly close. Why? Because Yellen had became extremely foreseeable, finally raising rates when the financial world had it already priced in, whilst Draghi announced the poorest extension of QE possible, sending European stocks markets sharply lower, and therefore helping the common currency in its latest recovery.
Win-win scenario for the greenback
Now hovering right below the 1.1000 figure, there's little more the pair can do this year, moreover as no major data is pending of release. So what's next from here?An educated guess is that the USD will end up winning the battle during this 2016, moreover if the ongoing policies are maintained by both Central Banks. The strength and length of the US rally will depend solely on the pace of future rate hikes in the US.
_20151222152529.png)
From a technical point of view, the dominant bearish tone remains firm in place, although it has long lost downward momentum. The monthly chart shows that the technical indicators are barely recovering from oversold levels, but that the pair is way below its moving averages, indicating that bears maintain the lead. The same chart also shows how strong buying interest is around the 1.0500 region and pretty much confirms that a break below the level is required to start speculating above parity as a probable target for 2016.
_20151222152602.png)
Parity will indeed be a major psychological support, which means that a break below should only fuel the panic sell-off, down to 0.9600, where the pair has several monthly highs and lows from 2001/2. A strong EUR seems out of the picture for now, with advances up to 1.1250 likely to be seen as barely correctives by market players. Should the pair recover above this last, it will need to retake the next resistance at the 1.1440/90 region, where the pair's advance stalled several times over these last few months.
In the weekly chart the pair is also correcting higher, but overall bearish, as the price stands below a flat 20 SMA, while the technical indicators have recovered from oversold levels but remain far below their mid-lines, also supporting the bearish case.
Anyway and as usual, the market will be full of imponderables that can change markets' perception of currencies in a blink. Trade what you see and not what you believe, and you can't get it wrong.
EURUSD Point & Figure Charts Forecast by Gonçalo Moreira, CMT
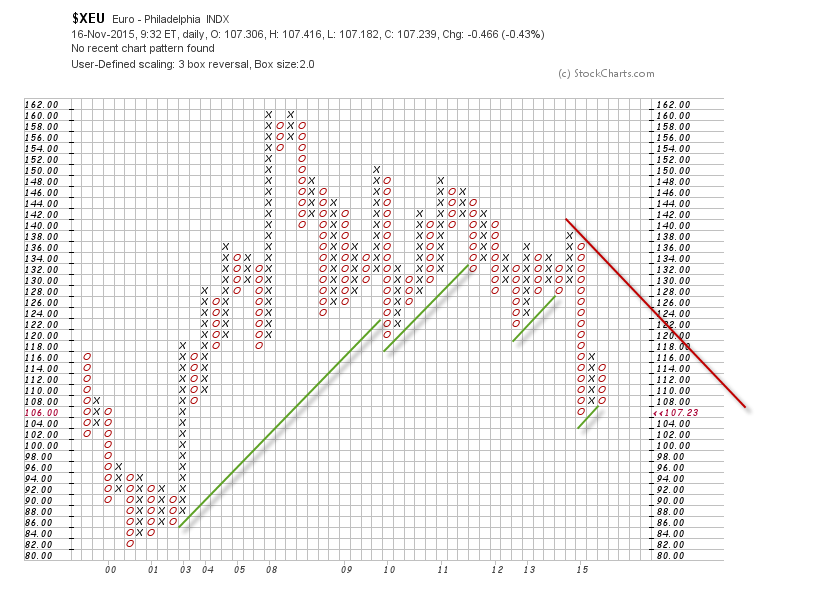
From a long-term perspective, as portrayed in the 3-box reversal chart below, the EUR/USD is really under the pump. The large column of Os -where each box corresponds to a 200 pip depreciation- drawn from the 1.3900 top is the one anchoring the objective bearish line (in red) dictating the bearish trend since last year. As long as this line is not violated, a point and figure analyst will consider the trend as bearish.
On this same resolution we don't have a double-bottom continuation signal yet. Only a firm break below 1.06 would print the sell signal and invalidate the green line nascent from a 1.0600 box. Likewise, only a close above 1.18 would generate double-top signal and threaten the 45 degree objective trend line.
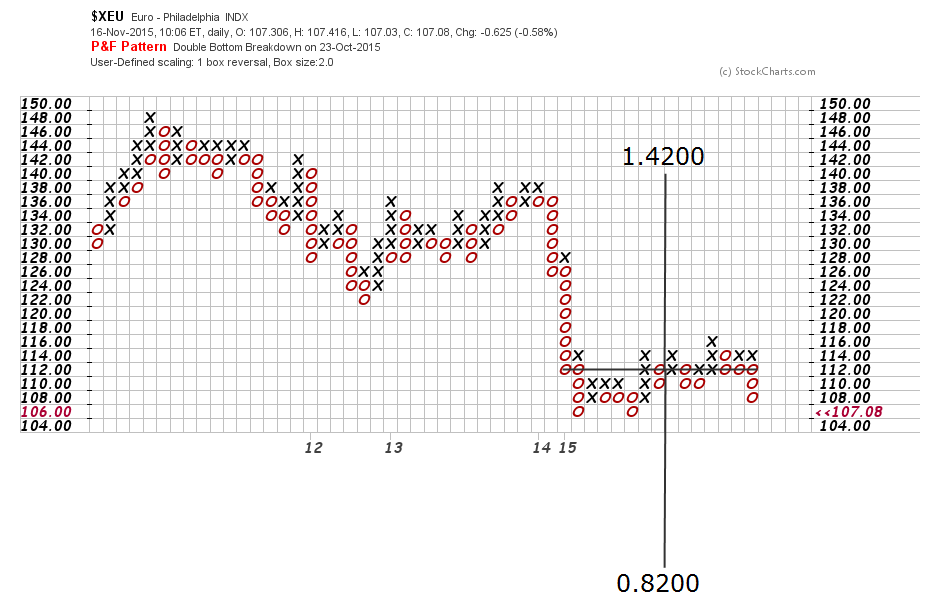
If we visit the EUR/USD 1-box reversal chart we can establish an horizontal count on both directions. On the upper side, a break above consolidation points to 1.4200, while on the way South, and reafirming the 3-box analysis, the calculation brings us below the historic low of 0.8400 to 0.8200
Read also other related articles about what 2016 could bring for the markets:
Currencies
GBP USD Forecast 2016
USD JPY Forecast 2016
Central Banks
ECB Forecast 2016
RBA Forecast 2016
PBoC Forecast 2016
FED Forecast 2016
BoE Forecast 2016
BoJ Forecast 2016
SNB Forecast 2016
Commodities
Gold Forecast 2016
Information on these pages contains forward-looking statements that involve risks and uncertainties. Markets and instruments profiled on this page are for informational purposes only and should not in any way come across as a recommendation to buy or sell in these assets. You should do your own thorough research before making any investment decisions. FXStreet does not in any way guarantee that this information is free from mistakes, errors, or material misstatements. It also does not guarantee that this information is of a timely nature. Investing in Open Markets involves a great deal of risk, including the loss of all or a portion of your investment, as well as emotional distress. All risks, losses and costs associated with investing, including total loss of principal, are your responsibility. The views and opinions expressed in this article are those of the authors and do not necessarily reflect the official policy or position of FXStreet nor its advertisers. The author will not be held responsible for information that is found at the end of links posted on this page.
If not otherwise explicitly mentioned in the body of the article, at the time of writing, the author has no position in any stock mentioned in this article and no business relationship with any company mentioned. The author has not received compensation for writing this article, other than from FXStreet.
FXStreet and the author do not provide personalized recommendations. The author makes no representations as to the accuracy, completeness, or suitability of this information. FXStreet and the author will not be liable for any errors, omissions or any losses, injuries or damages arising from this information and its display or use. Errors and omissions excepted.
The author and FXStreet are not registered investment advisors and nothing in this article is intended to be investment advice.
Recommended Content
Editors’ Picks

USD/JPY jumps above 154 after a hawkish Fed and ahead of BoJ
The USD/JPY pair is trading well above the 154.00 mark after the US Federal Reserve delivered a hawkish 25 bps rate cut. The Bank of Japan is expected to remain on hold, although a rate hike can't be ruled out.

EUR/USD nears year low amid a hawkish Federal Reserve
EUR/USD accelerated its slump after the Federal Reserve trimmed interest rates as expected but also released a dot-plot showing lesser interest rate cuts in 2025. The "hawkish cut" boosts demand for the US Dollar.

Gold nears $2,600 after Fed's decision
Gold fell towards $2,600 and trades nearby as the Federal Reserve's hawkish cut sent investors into safety. Demand for the US Dollar outpaces that of the bright metal as US, officials foresee fewer interest rate cuts in 2025.

Bitcoin, crypto market set for massive dump following Trump's inauguration: Arthur Hayes
Bitcoin (BTC) and the crypto market could face a massive sell-off as expectations for Donald Trump's administration of pro-crypto policies could be short-lived, according to Arthur Hayes.

Sticky UK services inflation to come lower in 2025
Services inflation is stuck at 5% and will stay around there for the next few months. But further progress, helped by more benign annual rises in index-linked prices in April, should see ‘core services’ inflation fall materially in the spring.

Best Forex Brokers with Low Spreads
VERIFIED Low spreads are crucial for reducing trading costs. Explore top Forex brokers offering competitive spreads and high leverage. Compare options for EUR/USD, GBP/USD, USD/JPY, and Gold.