EUR/USD Current Price: 1.1183
View Live Chart for the EUR/USD
The EURUSD pair extended its weekly decline down to 1.1158, and trades roughly 20 pips away from the level by the end of the US session, with the greenback higher against all of its major counterparts. A strong slide in commodities, alongside with more FED's officers pledging for a soon to come rate hike, were behind dollar's strength. Federal Reserve Bank of St. Louis President James Bullard and Chicago FED President Charles Evans, said policy makers should consider raising interest rates at least a couple of times this year, inspiring confidence in the US economic situation.
In the US, New Home sales rose 2.0% in February to a 512,000 annual pace, while January figures were also revised higher, to 502,000 from previous 494,000. The figures indicate some continued growth in the sector, although sales levels are still 6.1% below a year ago. Crude oil inventories jumped higher, with the EIA report showing a build of 9.37M against the 3.09M expected, pushing crude back towards the $ 40.00 a barrel region.
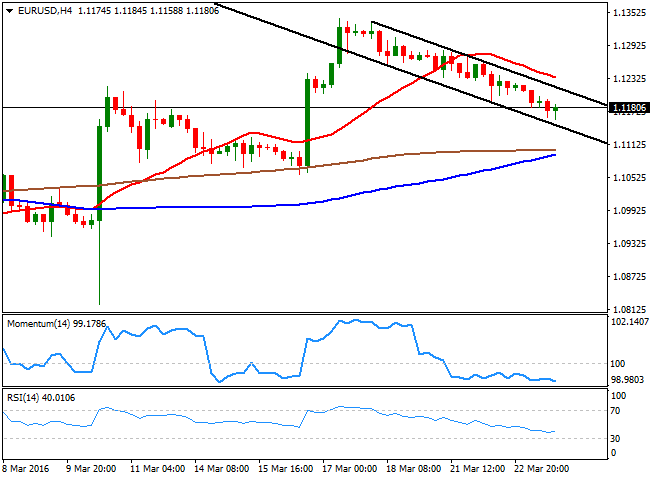
The pair has now declined for a fourth consecutive day, having trimmed half its FED's inspired gains, and seems poised to extend its decline, given that short term selling interest is now surging on approaches to the 1.1200 level. Technically, the 4 hours chart shows that the price remains midway inside a daily descendant channel, while the technical indicators present strong bearish slopes within bearish territory, supporting some additional declines for this Thursday, down to the 1.1085 level.
Support levels: 1.1160 1.1120 1.1085
Resistance levels: 1.1210 1.1245 1.1290
EUR/JPY Current price: 125.83
View Live Chart for the EUR/JPY
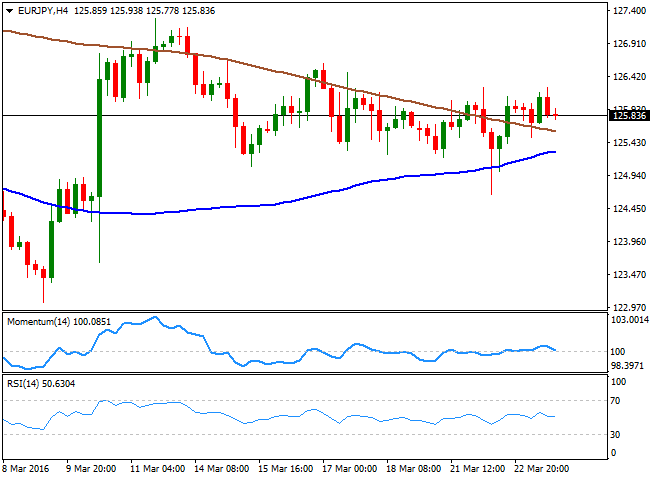
The EUR/JPY pair was unable to find direction this Wednesday, closing the day flat a few pips below the 126.00 level. Both, the Japanese Yen and the Euro were generally weaker against the greenback, with the first affected by a downward assessment of Japanese situation by BOJ's members, and the second pressured by an early rebound in European equities that kept it subdued. The short term technical picture has turned neutral, as in the 1 hour chart, the price is currently trading between its 100 and 200 SMAs, with the shortest offering an immediate support at 125.70. In the same chart, the technical indicators have turned horizontal around their mid-lines, indicating no clear upcoming direction. In the 4 hours chart, the price is still holding above a bearish 20 SMA, while the technical indicators lack directional strength within neutral territory, in line with the shorter term outlook.
Support levels: 125.70 125.40 125.00
Resistance levels: 126.50 126.90
GBP/USD Current price: 1.4110
View Live Chart for the GBP/USD
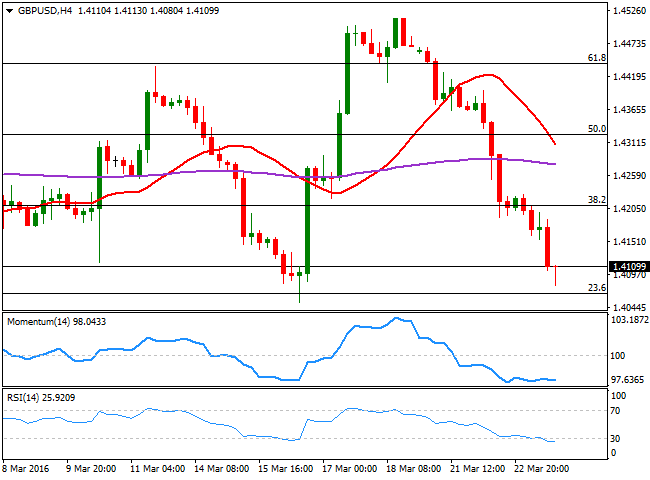
The GBP/USD pair remained under strong selling pressure, hitting a fresh 4-day low of 1.4080 during US trading hours. There was no catalyst behind this Wednesday's decline, as the UK did not publish any kind of macroeconomic data. But fears of a Brexit have been lately exacerbated, after a new poll showed the lead of the Remain campaign is slipping. The UK is expected to release its February Retail Sales figures for February during the upcoming session, expected to have fall into negative territory, something that will fuel concerns over the economic future of the kingdom, and further weigh on the Sterling. In the meantime, the short term technical picture shows that the risk remains towards the downside, as in the 1 hour chart, the price develops well below a bearish 20 SMA, while the technical indicators are hovering within oversold levels. In the 4 hours chart, technical readings are getting overstretched, as both the Momentum and the RSI are in extreme oversold territory. The pair has a strong support at 1.4052, March 16th low, and a break below it will likely send the pair below the 1.4000 critical psychological support.
Support levels: 1.4100 1.4050 1.4010
Resistance levels: 1.4160 1.4190 14225
USD/JPY Current price: 112.47
View Live Chart for the USD/JPY
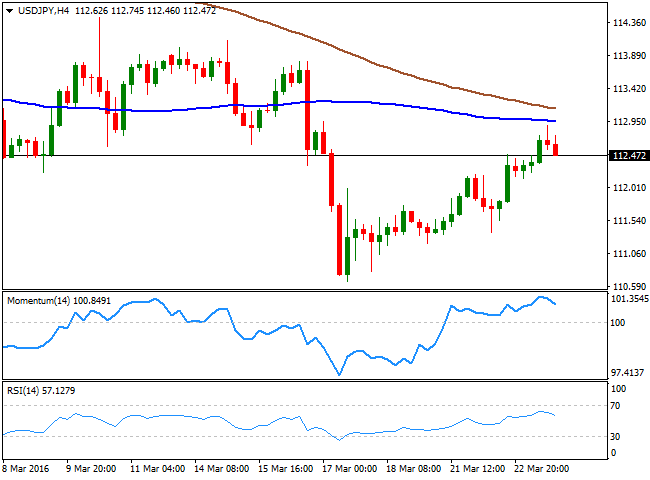
The USD/JPY pair continued rallying over the last session, with the dollar expending its gains up to 112.89, before retreating down to the current 112.47 level. The Japanese currency came under selling pressure during the past Asian session, as the government downgraded the economic assessment, expressing concerns on how the sluggish emerging market demand and volatile financial markets may hurt exports and capital expenditure. Also, the Abe administration has decided to cancel its plan to increase the sales tax from 8% to 10%, scheduled to be implemented in April 2017. The short term technical picture is showing that the early upward strength has lost steam, given that the price is now a few pips below its 200 SMA, whilst the technical indicators have turned south, and are about to cross their mid-lines towards the downside. In the 4 hours chart, the pair stalled its rally a handful of pips below its 100 SMA, while the technical indicators have also turned lower, but remain well above their mid-lines, limiting chances of a sharper decline, as long as buyers surge on approaches to the 112.00/10 region.
Support levels: 112.10 111.70 111.30
Resistance levels: 112.95 113.30 113.75
AUD/USD Current price: 0.7538
View Live Chart for the AUD/USD
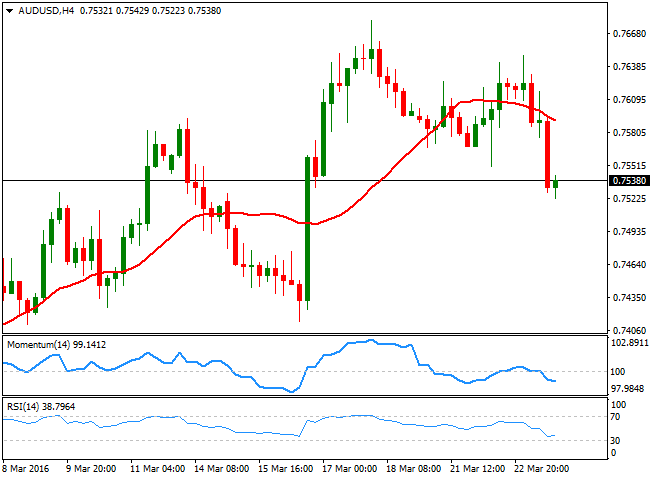
The Aussie was hit hard this Wednesday, falling down to 0.7522 against the greenback on the back of commodities' sharp decline. Precious metals plummeted, with spot gold reaching a daily low of $1,215 a troy ounce and silver closing the day near its daily lows. Additionally, and as more US policy makers have heightened the possibility of a rate hike as soon as next April, the dollar was broadly higher on improved market's sentiment. Except for the New Zealand trade balance, the macroeconomic calendar will remain empty during the upcoming Asian session, which means that currencies will likely continue trading on sentient. This latest slide in the AUD/USD has harmed partially the dominant bullish trend, with further declines below 0.7500 opening doors for a steeper decline. Short term, the 1 hour chart points for some additional slides, given that the technical indicators are heading lower, despite being in oversold territory, while the 20 SMA turned sharply lower, almost 100 pips above the current level. In the 4 hours chart, the price has finally extended well below its 20 SMA, while the technical indicators maintain bearish slopes within oversold territory, in line with the shorter term view.
Support levels: 0.7510 0.7470 0.7440
Resistance levels: .7550 0.7605 0.7640
Information on these pages contains forward-looking statements that involve risks and uncertainties. Markets and instruments profiled on this page are for informational purposes only and should not in any way come across as a recommendation to buy or sell in these assets. You should do your own thorough research before making any investment decisions. FXStreet does not in any way guarantee that this information is free from mistakes, errors, or material misstatements. It also does not guarantee that this information is of a timely nature. Investing in Open Markets involves a great deal of risk, including the loss of all or a portion of your investment, as well as emotional distress. All risks, losses and costs associated with investing, including total loss of principal, are your responsibility. The views and opinions expressed in this article are those of the authors and do not necessarily reflect the official policy or position of FXStreet nor its advertisers. The author will not be held responsible for information that is found at the end of links posted on this page.
If not otherwise explicitly mentioned in the body of the article, at the time of writing, the author has no position in any stock mentioned in this article and no business relationship with any company mentioned. The author has not received compensation for writing this article, other than from FXStreet.
FXStreet and the author do not provide personalized recommendations. The author makes no representations as to the accuracy, completeness, or suitability of this information. FXStreet and the author will not be liable for any errors, omissions or any losses, injuries or damages arising from this information and its display or use. Errors and omissions excepted.
The author and FXStreet are not registered investment advisors and nothing in this article is intended to be investment advice.
Recommended Content
Editors’ Picks
GBP/USD remains heavy below 1.2300 amid UK bond market sell-off
GBP/USD stays deep in the red below 1.2300 after recovering modestly from the 14-month-low it set below 1.2250. The pair bears the brunt of the UK bond market sell-off, with the 10-year gilt yield touching highest since August 2008.

EUR/USD recovers above 1.0300, markets await comments from Fed officials
EUR/USD gains traction and trades above 1.0300 on Thursday despite mixed German Industrial Production and Eurozone Retail Sales data. Retreating US bond yields limits the USD's gains and allows the pair to hold its ground as market focus shifts to Fedspeak.

Gold climbs to new multi-week high above $2,670
Gold extends its weekly recovery and trades at its highest level since mid-December above $2,670. The benchmark 10-year US Treasury bond yield corrects lower from the multi-month high it touched above 4.7% on Wednesday, helping XAU/USD stretch higher.

Bitcoin falls below $94,000 as over $568 million outflows from ETFs
Bitcoin continues to edge down, trading below the $94,000 level on Thursday after falling more than 5% this week. Bitcoin US spot Exchange Traded Funds recorded an outflow of over $568 million on Wednesday, showing signs of decreasing demand.

Recent developments in the global economy
United States: Recent business surveys suggest that the clean election outcome has led companies that delayed investment and hiring due to election/regulatory uncertainty to start putting money to work.

Best Forex Brokers with Low Spreads
VERIFIED Low spreads are crucial for reducing trading costs. Explore top Forex brokers offering competitive spreads and high leverage. Compare options for EUR/USD, GBP/USD, USD/JPY, and Gold.
