EUR/USD Current Price: 1.1269
View Live Chart for the EUR/USD
The common currency maintained its upside momentum for third week in-a-row, rallying against the greenback up to 1.1341 on the back of a dovish FED. The US Central Bank left rates on hold, but what actually hit the greenback was that FOMC members' median projection of rates that was cut by about 50bp, leaving just two possible hikes for this year, pretty much taking out of the table any kind of announcement until September. Over the past two weeks, the imbalance between the FED and the ECB kept widening, which means that in the long run, the USD should outperform the common currency. But given the uncertainty surrounding the pace of rate hikes in the US and ECB's Praet comments on prospects for potential future easing later in the year, the pair may keep rallying for a bit longer before turning south.
During this upcoming week, markets attention will focus in the EU PMIs, and German ZEW survey. In the US, investors will be looking for the outcome of Durable Goods Orders and the ISM Manufacturing PMI.
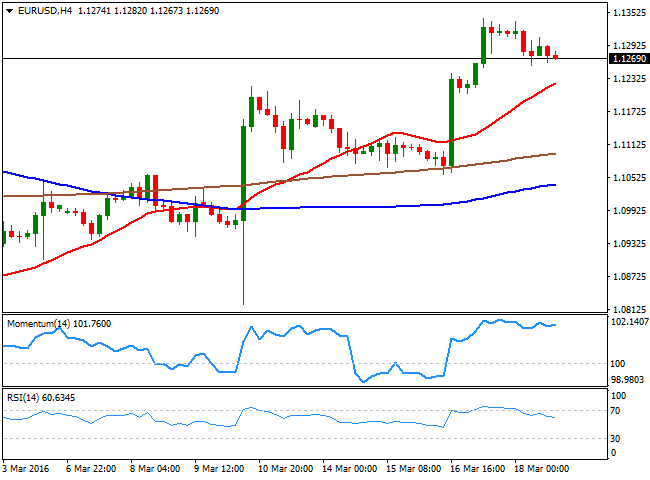
As for the technical picture of the EUR/USD, the pair closed the week at 1.1269, the highest close since last October, and Friday's pullback was not enough to damage the bullish tone, as in the daily chart, the technical indicators have barely retreated from overbought territory, with no downward momentum at this point. In the same chart, the pair is well above its moving averages, although the 100 and 200 DMAs remain pretty much horizontal, indicating that a more sustainable rally is yet to be confirmed. To achieved so, the pair needs to trigger stops beyond 1.1375 February high, which will open doors for a rally up to 1.1460 a major static resistance. Shorter term, and according to the 4 hours chart, the pair may continue advancing, as the Momentum indicator has turned north within overbought territory, whilst the 20 SMA heads sharply higher below the current level. Below 1.1245, the pair can decline down to 1.1200, but it will take a break below 1.1160 to harm the positive tone and see the pair returning to the 1.1000 region.
Support levels: 1.1245 1.1200 1.1160
Resistance levels: 1.1310 1.1340 1.1375
EUR/JPY Current price: 125.68
View Live Chart for the EUR/JPY
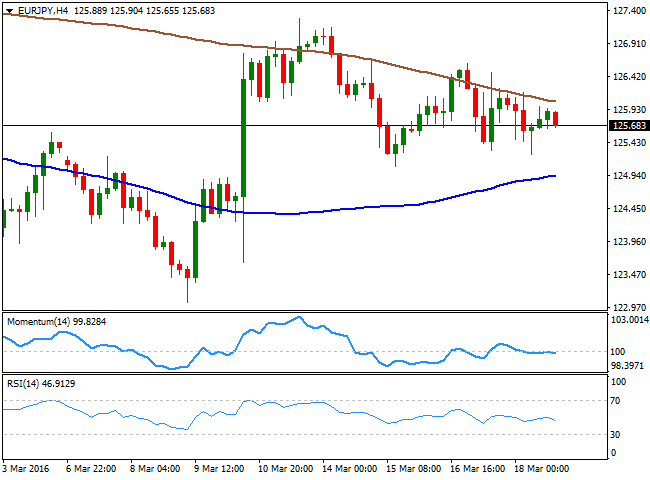
The Japanese Yen's strength led to a weekly decline of the EUR/JPY pair, which closed at 125.68 on Friday. The JPY strengthened after the BOJ stood pat on rates, although it downgraded its economic outlook and inflation expectations. Broad dollar's weakness and the Yen appreciating to 110.66 against the greenback, on the back of FED's announcement, triggered some rumors of a possible BOJ's intervention, leading to a slide in the Japanese currency by the end of the week, not enough however, to boost the pair. Technically, and according to the daily chart, the balance inclines slightly towards the downside, as the price stands well below a sharply bearish 100 DMA around 128.80, which additionally has accelerated below the 200 DMA. In the same chart, the Momentum indicator aims slightly higher within positive territory, but the RSI heads lower around its mid-line, favoring further declines on a break below 125.08, the weekly low. In the 4 hours chart, the pair presents a neutral-to-bearish technical stance, given that the price remains trapped between moving averages, with the 200 SMA capping now the upside around 126.10, while the technical indicators present limited bearish slopes around their mid-lines.
Support levels: 125.40 125.00 124.60
Resistance levels: 126.10 126.50 126.90
GBP/USD Current price: 1.4467
View Live Chart for the GBP/USD
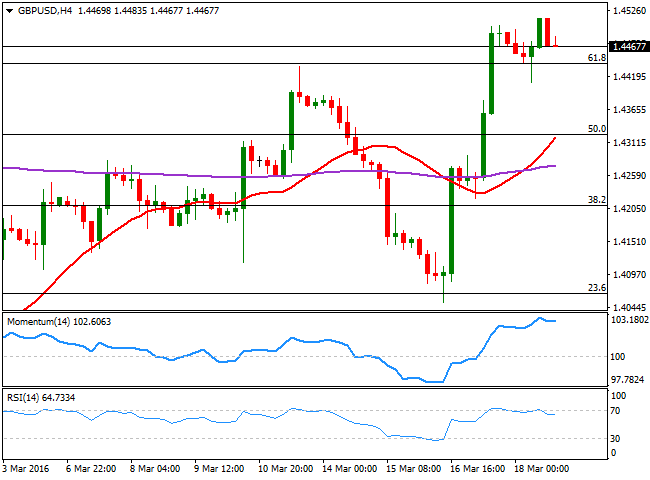
The Pound staged a brutal comeback against the greenback, after plummeting to 1.4052 on renewed fears of a possible Brexit. Mid week, the BOE maintained its economic policy unchanged, blaming partially a slowdown in economic growth to uncertainty surrounding Britain's referendum on its European Union membership. But the GBP/USD pair later surged as dollar got sold-off after the FED, extending its weekly rally on Friday up to 1.4513, the highest in over a month. Having partially retreated, the pair holds above 1.4440, the 61.8% retracement of this year´s decline, suggesting the bullish run may not be over. Technically, the daily chart shows that the technical indicators have lost upward strength near overbought levels, but also that the price holds well above a bullish 20 DMA. The 100 DMA stands at 1.4565, and if the price manages to go through it, the rally can then complete a full 100% retracement to 1.4815, this year high. In the 4 hours chart, the technical indicators have corrected overbought readings, but show no downward strength, whilst the 20 SMA has turned sharply higher well below the current level, in line with the longer term tone.
Support levels: 1.4440 1.4405 1.4370
Resistance levels: 1.4520 1.4565 1.4600
USD/JPY Current price: 111.52
View Live Chart for the USD/JPY
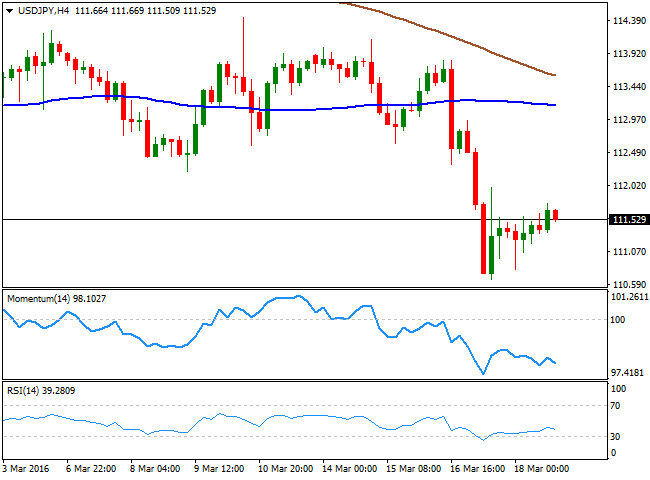
The USD/JPY came under strong selling pressure on FED-based dollar's weakness, plummeting down to 110.66 after triggering stops below the 111.00 figure. Despite improved risk sentiment, the Japanese yen surged on the back of lower US yields as the 10Y Treasury yield has fallen for the most since January last week. The pair however, bounced strongly in what the market believes was some sort of BOJ-induced intervention, by having called interbank dealers to "check exchange rates." The pair bounced up to 111.99 after the move, to settle around 111.50, unable to move far away from this last during Friday. Holding near the base of its previous range, the USD/JPY pair daily chart suggests further declines for the forthcoming sessions, as the technical indicators have broken their mid-lines and remain near oversold territory, having posted shallow bounces that are not enough to revert the downward pressure. In the 4 hours chart, the technical indicators have turned south within negative territory after correcting oversold readings, whilst the 200 SMA has accelerated its decline and approaches the 100 SMA, well above the current level, in line with the longer term perspective.
Support levels: 111.05 110.65 110.20
Resistance levels: 111.65 112.00 112.35
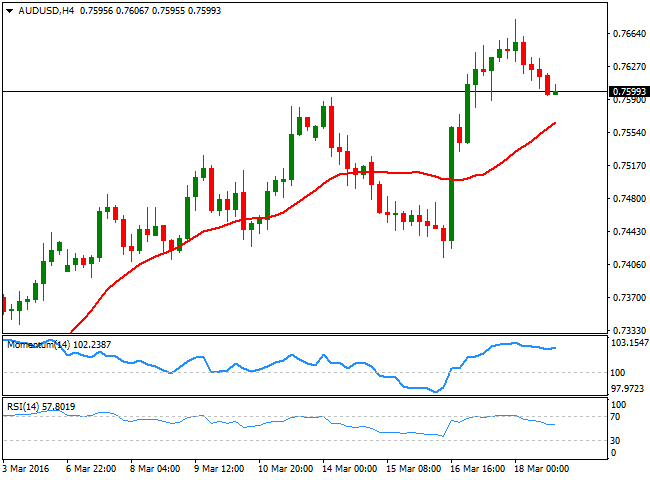
AUD/USD Current price: 0.7599
View Live Chart for the AUD/USD
The Australian dollar retreated on Friday from a fresh 8-month high of 0.7679 against the greenback, but closed the day with gains, around 0.7600. The strong advance in commodities and stocks, underpinned the antipodean currency, now among the strongest across the forex board. Employment data last Thursday showed that the jobless rate fell to 5.8%, in spite employment barely rose in February, matching latest positive economic data coming from Australia, and pointing for a continued advance of the local currency. Technically, the daily chart shows that the pair has steadily posted higher highs and higher lows during the past three days, while advancing above a strongly bullish 20 SMA currently at 0.7400, whilst the technical indicators have barely corrected overbought readings, holding nearby. In the 4 hours chart, the technical indicators have resumed their advances after correcting extreme overbought readings, whilst the 20 SMA maintains a strong upward slope around 0.7565, the immediate support.
Support levels: 0.7565 0.7520 0.7470
Resistance levels: 0.7630 0.7680 0.7720
Information on these pages contains forward-looking statements that involve risks and uncertainties. Markets and instruments profiled on this page are for informational purposes only and should not in any way come across as a recommendation to buy or sell in these assets. You should do your own thorough research before making any investment decisions. FXStreet does not in any way guarantee that this information is free from mistakes, errors, or material misstatements. It also does not guarantee that this information is of a timely nature. Investing in Open Markets involves a great deal of risk, including the loss of all or a portion of your investment, as well as emotional distress. All risks, losses and costs associated with investing, including total loss of principal, are your responsibility. The views and opinions expressed in this article are those of the authors and do not necessarily reflect the official policy or position of FXStreet nor its advertisers. The author will not be held responsible for information that is found at the end of links posted on this page.
If not otherwise explicitly mentioned in the body of the article, at the time of writing, the author has no position in any stock mentioned in this article and no business relationship with any company mentioned. The author has not received compensation for writing this article, other than from FXStreet.
FXStreet and the author do not provide personalized recommendations. The author makes no representations as to the accuracy, completeness, or suitability of this information. FXStreet and the author will not be liable for any errors, omissions or any losses, injuries or damages arising from this information and its display or use. Errors and omissions excepted.
The author and FXStreet are not registered investment advisors and nothing in this article is intended to be investment advice.
Recommended Content
Editors’ Picks

EUR/USD struggles to hold above 1.0400 as mood sours
EUR/USD stays on the back foot and trades near 1.0400 following the earlier recovery attempt. The holiday mood kicked in, keeping action limited across the FX board, while a cautious risk mood helped the US Dollar hold its ground and forced the pair to stretch lower.
GBP/USD approaches 1.2500 on renewed USD strength
GBP/USD loses its traction and trades near 1.2500 in the second half of the day on Monday. The US Dollar (USD) benefits from safe-haven flows and weighs on the pair as trading conditions remain thin heading into the Christmas holiday.

Gold hovers around $2,610 in quiet pre-holiday trading
Gold struggles to build on Friday's gains and trades modestly lower on the day near $2,620. The benchmark 10-year US Treasury bond yield edges slightly higher above 4.5%, making it difficult for XAU/USD to gather bullish momentum.

Bitcoin fails to recover as Metaplanet buys the dip
Bitcoin hovers around $95,000 on Monday after losing the progress made during Friday’s relief rally. The largest cryptocurrency hit a new all-time high at $108,353 on Tuesday but this was followed by a steep correction after the US Fed signaled fewer interest-rate cuts than previously anticipated for 2025.

Bank of England stays on hold, but a dovish front is building
Bank of England rates were maintained at 4.75% today, in line with expectations. However, the 6-3 vote split sent a moderately dovish signal to markets, prompting some dovish repricing and a weaker pound. We remain more dovish than market pricing for 2025.

Best Forex Brokers with Low Spreads
VERIFIED Low spreads are crucial for reducing trading costs. Explore top Forex brokers offering competitive spreads and high leverage. Compare options for EUR/USD, GBP/USD, USD/JPY, and Gold.
