EUR/USD Current Price: 1.1084
View Live Chart for the EUR/USD
The American dollar was partially benefited by the return of risk appetite this Monday, ending the day higher against most of its major rivals. But the advance seems for the most a correction, following the strong sell-off the currency suffered by the end of last week. With no much macroeconomic data to guide investors, a strong advance in worldwide stocks and news that Iran said it would raise oil' s output to pre-sanctions levels before joining talks to freeze production, sealed the tone in the FX board. The macroeconomic calendar was empty, but for the release of the EU Industrial Production data, showing an increase of 2.1% monthly basis in January.
All eyes are now on the US Federal Reserve economic policy meeting next Wednesday. The FOMC seems more concern over the global developments than by the local woes, but there is a considerable uncertainty on whether the Central Bank may remain on hold, or open doors for a rate hike in June, which means majors will likely remain range bound ahead of the release.
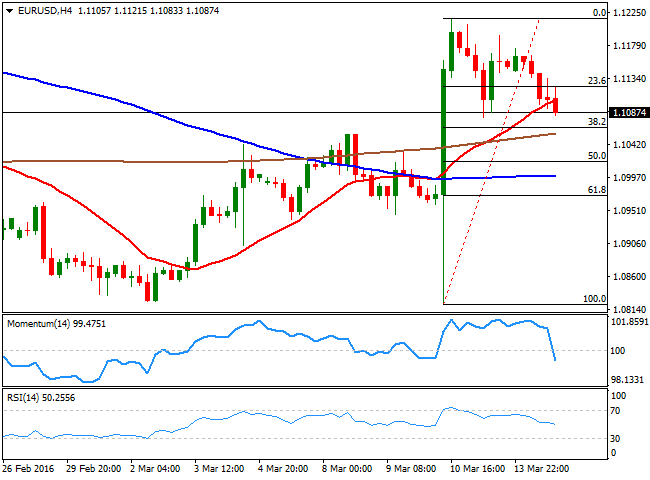
The EUR/USD eased further from the high set last week at 1.1217, and broke below the 1.1100 figure ahead of Wall Street's close, heading towards the 38.2% retracement of the post-ECB rally at 1.1065, the immediate support. The technical readings in the 4 hours chart show that the price is now extending below a bullish 20 SMA, while the technical indicators head sharply lower below their mid-lines, limiting chances of a sudden recovery for the upcoming Asian session. Should the price extend its decline below the mentioned Fibonacci support, the most likely scenario is a continued slide towards the 1.1000 figure for this Tuesday.
Support levels: 1.1065 1.1020 1.0980
Resistance levels: 1.1120 1.1160 1.1200
EUR/JPY Current price: 126.15
View Live Chart for the EUR/JPY
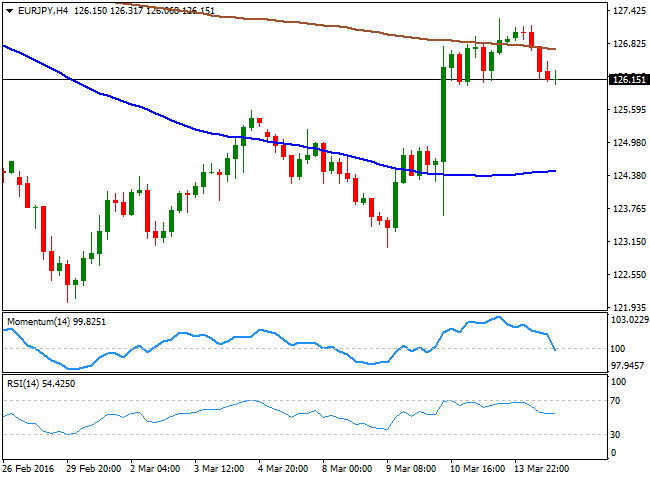
The EUR/JPY pair retreated from the high set at 127.28 on Friday, and neared the 126.00 level in the American afternoon, weighed by EUR's weakness. The Bank of Japan will have its first economic policy meeting after cutting rates into negative territory during the upcoming Asian session, but chances are of an on-hold stance. Investors, however, will be closely watching Kuroda's comments, looking for clues on any possible upcoming decision. From a technical point of view, the short term picture offers a mild bearish perspective, as in the 1 hour chart, the price remains well above its 100 and 200 SMAs, but the technical indicators hover near oversold levels, unable to signal an upward move. In the 4 hours chart, the pair is now below its 200 SMA, whilst the Momentum indicator is crossing its mid-line towards the downside with a strong bearish slope, and the RSI indicator holds flat around neutral territory, favoring further declines on a break below the daily low set at 126.05.
Support levels: 126.05 125.50 125.10
Resistance levels: 126.60 127.20 127.70
GBP/USD Current price: 1.4299
View Live Chart for the GBP/USD
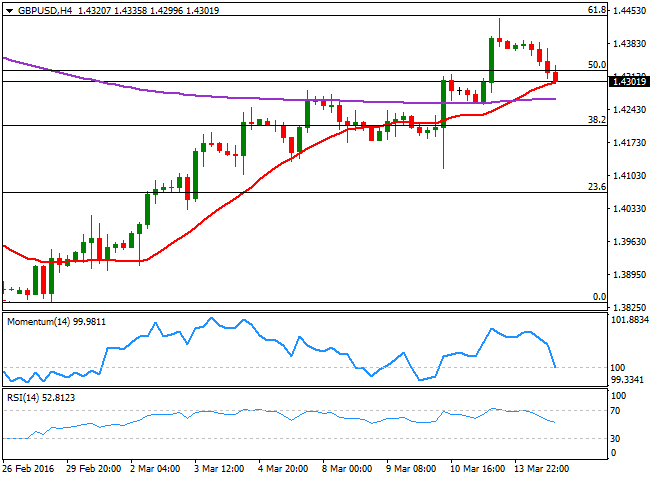
The GBP/USD pair flirted with the 1.4300 level this Monday, tracking a decline in oil prices and with no local data to underpin the Pound. The macroeconomic calendar, however, will be more interesting starting next Wednesday, when the UK will release its February employment data. Also, the Bank of England will have its economic policy meeting next Thursday, largely expected to maintain the status quo. Many market players believe that the pair is undervalued, but it topped out last week at a major resistance level, the 61.8% retracement of this year's decline, between 1.4815 and 1.3835, and to confirm a continued advance the pair needs to regain the 1.4450 level. In the meantime, the 1 hour chart presents a clear short term bearish tone, as the technical indicators head sharply lower near oversold levels, whilst the pair is extending its decline below a bearish 20 SMA. In the 4 hours chart, the price is pressuring a bullish 20 SMA, while the technical indicators have turned sharply lower around their mid-lines, increasing the risk of further declines, particularly on a break below 1.4260, the 200 EMA and the immediate support.
Support levels: 1.4260 1.4225 1.4170
Resistance levels: 1.4330 1.4370 1.4415
USD/JPY Current price: 113.81
View Live Chart for the USD/JPY
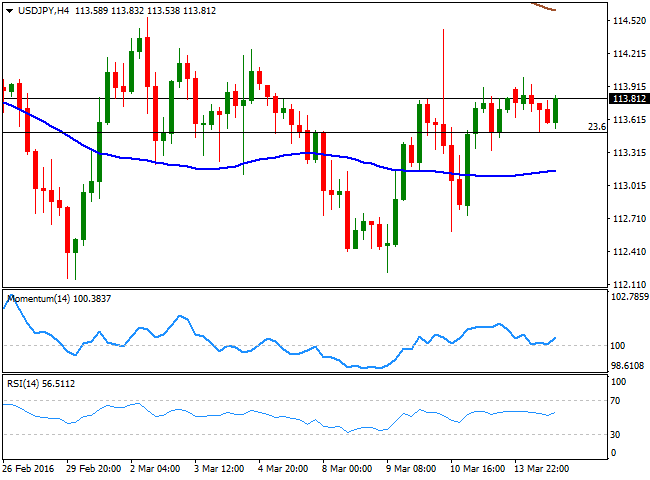
The USD/JPY pair traded within a limited range at the beginning of the week, meeting short term buying interest around the strong static support at 113.50, the 23.6% retracement of the latest daily bearish run. Ahead of the monetary policy meeting of the Bank of Japan, the pair maintains a neutral technical stance, having been unable to leave the 112.10/114.60 for the past two weeks. The BOJ is largely expected to leave its economic policy unchanged, while Governor Kuroda will likely reiterate that the country's is economy is doing well and heading towards the 2.0% inflation target, to be reached by mid 2017. Unless he is able to provide a surprise, the pair is not expected to react to the news, but continue to trade on sentiment. Technically, the short term picture presents a limited positive tone, as in the 1 hour chart, the price held above its moving averages, whilst the technical indicators head slightly higher above their mid-lines. In the 4 hours chart, the technical stance is neutral, with the technical indicators barely bouncing from their mid-lines, but lacking enough strength to confirm a new leg higher.
Support levels: 113.50 113.10 112.70
Resistance levels: 114.00 114.60 115.05
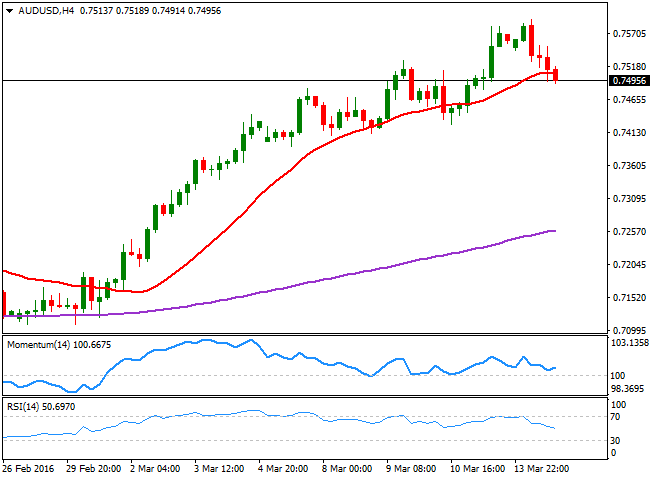
AUD/USD Current price: 0.7495
View Live Chart for the AUD/USD
The AUD/USD pair advanced up to 0.7593, a fresh 8-month high, before shedding some 100 pips on the back of a strong decline in commodities´ prices. The Reserve Bank of Australia will publish the Minutes of its latest meeting during the upcoming hours, but it's hardly expected to trigger some moves in the Aussie, given that Governor Stevens has anticipated most of its content during the statement following the meeting earlier this month. Chinese economic slowdown also weighs over the Aussie as China's Industrial production rose a weaker-than-expected 5.4% y/y in February and Retail Sales climbed a slower-than-forecast 10.2% y/y. Nevertheless, sentiment towards the antipodean currency is still bullish, and there are no technical confirmations of a top having taken place. Technically, the 1 hour chart shows that the price has accelerated its decline after breaking below a now bearish 20 SMA, while the technical indicators keep heading south, despite being near oversold levels. In the 4 hours chart, the price is currently extending below its 20 SMA while the RSI heads south around 50 and the Momentum indicator lags, heading north above the 100 level, supporting a limited decline ahead.
Support levels: 0.7465 0.7430 0.7390
Resistance levels: 0.7530 0.7580 0.7630
Information on these pages contains forward-looking statements that involve risks and uncertainties. Markets and instruments profiled on this page are for informational purposes only and should not in any way come across as a recommendation to buy or sell in these assets. You should do your own thorough research before making any investment decisions. FXStreet does not in any way guarantee that this information is free from mistakes, errors, or material misstatements. It also does not guarantee that this information is of a timely nature. Investing in Open Markets involves a great deal of risk, including the loss of all or a portion of your investment, as well as emotional distress. All risks, losses and costs associated with investing, including total loss of principal, are your responsibility. The views and opinions expressed in this article are those of the authors and do not necessarily reflect the official policy or position of FXStreet nor its advertisers. The author will not be held responsible for information that is found at the end of links posted on this page.
If not otherwise explicitly mentioned in the body of the article, at the time of writing, the author has no position in any stock mentioned in this article and no business relationship with any company mentioned. The author has not received compensation for writing this article, other than from FXStreet.
FXStreet and the author do not provide personalized recommendations. The author makes no representations as to the accuracy, completeness, or suitability of this information. FXStreet and the author will not be liable for any errors, omissions or any losses, injuries or damages arising from this information and its display or use. Errors and omissions excepted.
The author and FXStreet are not registered investment advisors and nothing in this article is intended to be investment advice.
Recommended Content
Editors’ Picks

EUR/USD turns lower below 1.0350 after German data
EUR/USD comes under mild selling pressure and eases below 1.0350 in the European session on Wednesday. The pair bears the brunt of an unexpected slowdown in the German manufacturing sector, as the nation's Retail Sales data fail to inspire the Euro. Focus shifts to US ADP data and Fed Minutes.

GBP/USD stays defensive below 1.2500 ahead of key US data, Fed Minutes
GBP/USD stays defensive below 1.2500 in the European trading hours on Wednesday, undermined by a risk-off market sentiment and elevated US Treasury bond yields on increased hawkish Fed bets. Traders look to US data, Fedspeak and FOMC Minutes for fresh trading impulse.

Gold price sticks to modest gains; upside seems limited ahead of FOMC Minutes
Gold price (XAU/USD) sticks to modest intraday gains through the first half of the European session on Wednesday, albeit it lacks bullish conviction and remains below the $2,665 resistance zone retested the previous day.

ADP Employment Change set to show US job growth slowing in December, Fed unlikely to alter plans
The ADP Employment Change will likely have a limited impact on financial markets. The US private sector is expected to have added 139,000 new positions in December.
Five fundamentals for the week: Nonfarm Payrolls to keep traders on edge in first full week of 2025 Premium
Did the US economy enjoy a strong finish to 2024? That is the question in the first full week of trading in 2025. The all-important NFP stand out, but a look at the Federal Reserve and the Chinese economy is also of interest.

Best Forex Brokers with Low Spreads
VERIFIED Low spreads are crucial for reducing trading costs. Explore top Forex brokers offering competitive spreads and high leverage. Compare options for EUR/USD, GBP/USD, USD/JPY, and Gold.
