EUR/USD Current Price: 1.0858
View Live Chart for the EUR/USD
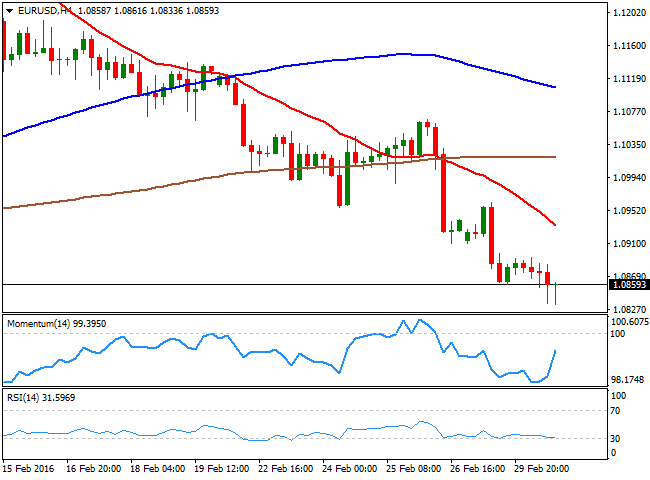
The common currency extended its modest decline against the greenback to 1.0833 this Tuesday, following more signs of a global economic slowdown. Manufacturing PMI surveys were tepid all across the globe, although US data was a bit more encouraging. In China, the official manufacturing PMI survey declined by 0.4 point to 49.0 in February reaching its lowest level since November 2011, while the EU reading fell to a 12-month low in February of 51.2 against previous 52.3. The rest of the major European economies, with the exception of Germany, printed readings below expectations, and neared the 50.0 mark. The only positive news came from Germany, as unemployment in the country decrease by 10,000 in February, leaving the unemployment rate unchanged at 6.2%. In the US, the ISM manufacturing index rose to 49.5 from 47.8 in January, still in contraction territory, while construction spending rose 1.5% in January, with increases in private and public spending.
The EUR/USD pair, however, was unable to attract investors, slowly sliding towards the mentioned daily low, weighed by speculations the ECB may take some aggressive easing measures in its March meeting. Technically, the 4 hours chart shows that the price has bounced some from the mentioned low, while the Momentum indicator heads higher within bearish territory, recovering from oversold readings. The fact that price did not follow the indicator suggests that bears are still in control. In the same chart, the RSI indicator consolidates near oversold readings, whilst the 20 SMA maintains a sharp bearish slope above the current level, all of which supports a test of the critical 1.0800/10 region, where buyers have been defending the downside pretty much since last December. Should the pair trigger the large stops suspected below this region, the decline will likely extend towards the 1.0700 region.
Support levels: 1.0810 1.0770 1.0730
Resistance levels: 1.0890 1.0925 1.0960
EUR/JPY Current price: 124.64
View Live Chart for the EUR/JPY
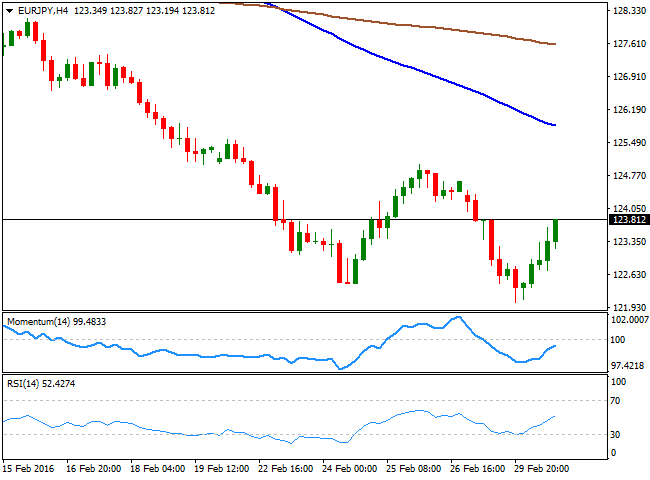
With the EUR in neutral mode, and the Japanese yen weakening on slightly firmer US yields and rising equities, the EUR/JPY pair advanced towards the 124.00 region, having erased most of its Monday losses. Quoting near its daily high of 123.85, the pair is short term bullish, as in the 1 hour chart, the price extended above its 100 SMA, whilst the technical indicators are partially losing their upward strength, but remain near overbought levels. In the 4 hours chart, an upward continuation is still to be confirmed, most likely with an upward acceleration beyond last week high around 125.00, as the Momentum indicator heads higher, but below the 100 level, while the RSI seems more constructive, advancing at 52. In this last time frame, the 100 SMA has accelerated further below the 200 SMA, with the shortest around 125.90, too far away to be relevant this Wednesday.
Support levels: 123.40 122.80 122.35
Resistance levels: 124.10 124.55 125.00
GBP/USD Current price: 1.3967
View Live Chart for the GBP/USD
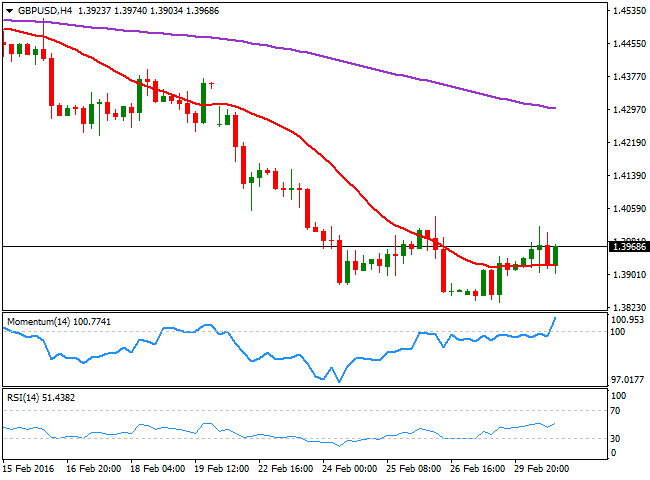
The Sterling advanced for a second day in-a-row, although the GBP/USD pair is ending the day below the daily high set at 1.4017 during the European session. The pair gave back its gains following the release of February's manufacturing PMI that fell more than expected to 50.8, against market expectations of a slight decline to 52.2, the lowest reading since early 2013. Nevertheless, intraday buying interest surged on approaches to the 1.3900 level, suggesting bears have lost interest at current levels. Short term, the pair presents a mild bullish tone, as in the 1 hour chart, the price has managed to recover above a bullish 20 SMA, whilst the technical indicators have bounced from their mid-lines, indicating the pair may continue advancing. In the 4 hours chart, the price has bounced several times from a horizontal 20 SMA, whilst the technical indicators are currently advancing above their mid-lines, in line with the shorter term perspective. Nevertheless, it would take an upward acceleration beyond the 1.4020 level to see a more sustainable advance during the upcoming hours that can extend up to the 1.4100 region.
Support levels: 1.3960 1.3920 1.3875
Resistance levels: 1.4020 1.4060 1.4100
USD/JPY Current price: 114.01
View Live Chart for the USD/JPY
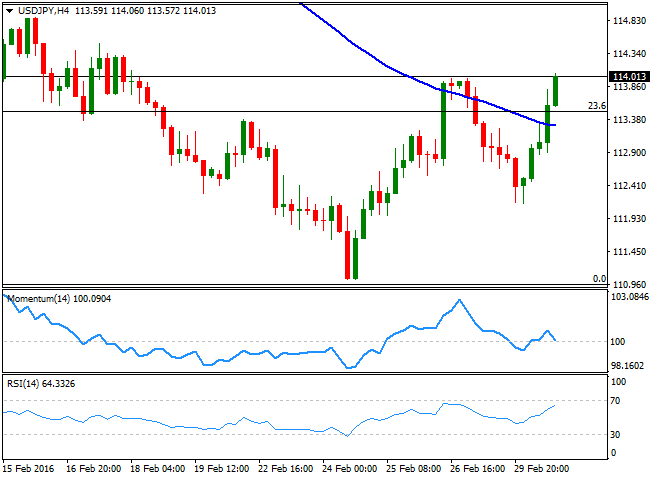
The American dollar outperformed against the Japanese yen, as the pair advanced a couple of pips beyond the 114.00 level in the American afternoon, supported by rising stocks worldwide. The pair traded as low as 112.15 this Tuesday, down at the beginning of the day as Monday's negative mood favored safe-haven assets. Anyway, the price is currently at a major resistance level, and some consolidation should be expected, as the current region stands for the past two sessions highs. Still far below the 38.2% retracement of its latest daily decline at 115.05, the daily chart shows that the technical indicators have turned higher around their mid-lines, rather reflecting this daily gain than suggesting further advances. In the shorter term, the price has accelerated well above its moving averages, with the 100 SMA crossing above the 200 SMA, and at the same time, the technical indicators are giving some signs of exhaustion within oversold territory. Nevertheless, with the pair pressuring its daily high, a new leg higher may follow after some consolidation. In the 4 hours chart, the technical indicators diverge from each other, with the Momentum heading lower and the RSI higher, both above their mid-lines.
Support levels: 113.50 113.15 112.60
Resistance levels: 114.10 114.60 115.00
AUD/USD Current price: 0.7162
View Live Chart for the AUD/USD
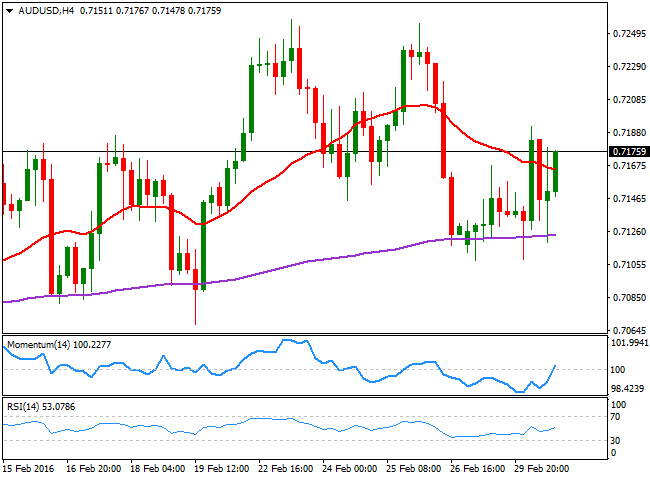
The Australian dollar advanced to a fresh weekly high of 0.7191 against the greenback, holding on to gains by the end of the day. Earlier this Tuesday, the RBA left rates on hold at 2.0% and the following statement was broadly in line with market's expectations and was even perceived as relatively hawkish, especially considering the stable inflation outlook. Still far from its recent highs, the technical outlook is bullish, as in the 1 hour chart, the price has quickly recovered on brief dips below a bullish 20 SMA, whilst the technical indicators have turned higher after a limited downward move, well above their mid-lines. In the 4 hours chart, the price held above its 200 EMA, while it's currently advancing above a mild bearish 20 SMA, and the technical indicators are crossing their mid-lines towards the upside. The pair has met selling interest in the 0.7240/60 region since early February, which means that the pair needs to break above this level to be able to rally further.
Support levels: 0.7160 0.7115 0.7070
Resistance levels: 0.7210 0.7260 0.7300
Information on these pages contains forward-looking statements that involve risks and uncertainties. Markets and instruments profiled on this page are for informational purposes only and should not in any way come across as a recommendation to buy or sell in these assets. You should do your own thorough research before making any investment decisions. FXStreet does not in any way guarantee that this information is free from mistakes, errors, or material misstatements. It also does not guarantee that this information is of a timely nature. Investing in Open Markets involves a great deal of risk, including the loss of all or a portion of your investment, as well as emotional distress. All risks, losses and costs associated with investing, including total loss of principal, are your responsibility. The views and opinions expressed in this article are those of the authors and do not necessarily reflect the official policy or position of FXStreet nor its advertisers. The author will not be held responsible for information that is found at the end of links posted on this page.
If not otherwise explicitly mentioned in the body of the article, at the time of writing, the author has no position in any stock mentioned in this article and no business relationship with any company mentioned. The author has not received compensation for writing this article, other than from FXStreet.
FXStreet and the author do not provide personalized recommendations. The author makes no representations as to the accuracy, completeness, or suitability of this information. FXStreet and the author will not be liable for any errors, omissions or any losses, injuries or damages arising from this information and its display or use. Errors and omissions excepted.
The author and FXStreet are not registered investment advisors and nothing in this article is intended to be investment advice.
Recommended Content
Editors’ Picks
GBP/USD remains heavy below 1.2300 amid UK bond market sell-off
GBP/USD stays deep in the red below 1.2300 after recovering modestly from the 14-month-low it set below 1.2250. The pair bears the brunt of the UK bond market sell-off, with the 10-year gilt yield touching highest since August 2008.

EUR/USD holds near 1.0300, markets await comments from Fed officials
EUR/USD remains on the back foot at around 1.0300 on Thursday following mixed German Industrial Production and Eurozone Retail Sales data. The cautious market mood supports the USD and doesn't allow the pair to stage a rebound as market focus shifts to Fedspeak.

Gold climbs to new multi-week high above $2,670
Gold extends its weekly recovery and trades at its highest level since mid-December above $2,670. The benchmark 10-year US Treasury bond yield corrects lower from the multi-month high it touched above 4.7% on Wednesday, helping XAU/USD stretch higher.

Bitcoin falls below $94,000 as over $568 million outflows from ETFs
Bitcoin continues to edge down, trading below the $94,000 level on Thursday after falling more than 5% this week. Bitcoin US spot Exchange Traded Funds recorded an outflow of over $568 million on Wednesday, showing signs of decreasing demand.

Recent developments in the global economy
United States: Recent business surveys suggest that the clean election outcome has led companies that delayed investment and hiring due to election/regulatory uncertainty to start putting money to work.

Best Forex Brokers with Low Spreads
VERIFIED Low spreads are crucial for reducing trading costs. Explore top Forex brokers offering competitive spreads and high leverage. Compare options for EUR/USD, GBP/USD, USD/JPY, and Gold.
