EUR/USD Current Price: 1.0832
View Live Chart for the EUR/USD
The American dollar closed last Friday broadly higher against most of its major rivals, although gains were not enough to erase its previous losses in most of the cases. The trigger for dollar's rally was the Bank of Japan, as the Central Bank introduced negative rates, announcing of a -0.10% interest rate on current accounts that financial institutions hold at the BOJ. Also helping the greenback was the release of the US Q4 advanced GDP data, with a small downside surprise, as it showed a 0.7% growth against the 0.8% expected. The slowdown in the US by the end of 2015 was already anticipated by the FED last Wednesday, and it seems that market's players had priced in an even lower reading ahead of the release, given that the currency gained sharply after the announcement. The rally stalled with the release of the final Michigan sentiment index that declined to 92.0 during January.
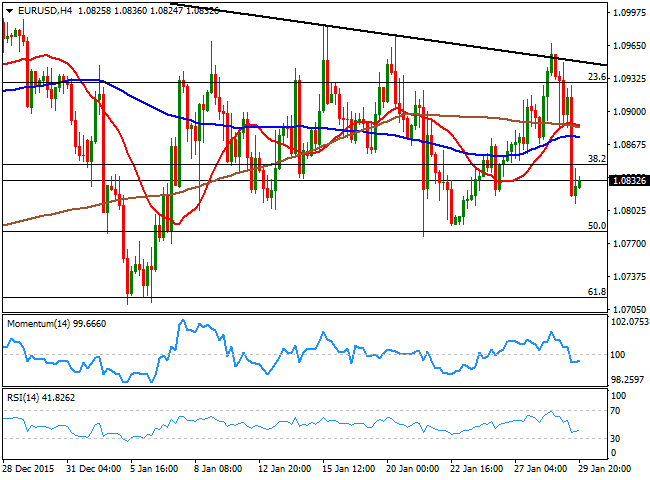
The EUR/USD pair closed the week at 1.0832 after being rejected by a daily descendant trend line in an advance up to 1.0967, a zone in where the pair had met selling interest several times over the past January. Holding near the base of its range, the pair continues lacking long term definitions, as it has been trapped for over a month in a 200 pips' range. Short term the 4 hours chart maintains the risk towards the downside, given that the technical indicators are standing below their mid-lines, and the price below the moving averages. The immediate resistance for this Monday comes at 1.0845, a Fibonacci level, while the main support is the 1.0770/800 region.
Support levels: 1.0810 1.0770 1.0730
Resistance levels: 1.0845 1.0890 1.0925
EUR/JPY Current price: 131.14
View Live Chart for the EUR/JPY
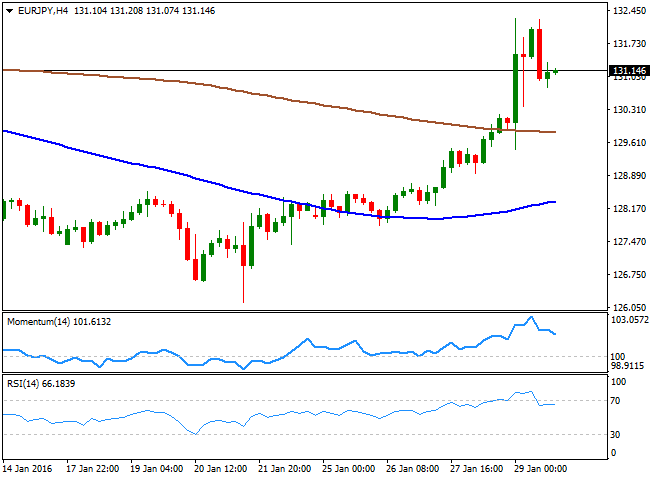
The EUR/JPY advanced up to 132.27, establishing there a monthly high, as the Japanese Yen plummeted during the Asian session following BOJ's decision to introduce “quantitative and qualitative monetary easing with a negative interest rate.” The cross jumped over 200 pips after the news, but gave up ground later in the day on EUR weakness, ending the day right above the 131.00 level. From a technical point of view, the 1 hour chart shows that the technical indicators retreated from overbought levels and entered negative territory where they stand, holding anyway above its moving averages. In the 4 hours chart, the Momentum indicator heads lower from overbought readings, but remains well above its mid-line at the time being, while the RSI indicator stands around 66. Should the price ease below the 131.00 level, the risk will turn towards the downside with buyers probably surging 100 pips lower, around the key 130.00 figure.
Support levels: 131.00 131.55 130.10
Resistance levels: 131.40 131.85 132.30
GBP/USD Current price: 1.4249
View Live Chart for the GBP/USD
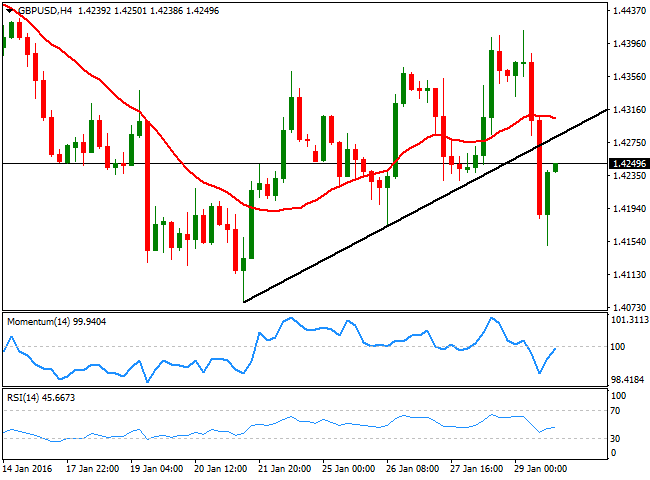
The GBP/USD pair closed the week flat around 1.4250, having set a high of 1.4412 earlier this week. The Pound however, was unable to hold to early week gains as the background weakness remains firm in place, as expectations of a UK rate hike have been steadily decreasing since late 2015. During this upcoming days, the BOE will have its monthly economic policy meeting, expected to remain as a non-event, particularly after BOE Governor, Mark Carney, said that “now is not yet the time to raise interest rates.” The pair started the week with a positive tone, but gains where moderated by the negative sentiment towards the British currency that is set to extend this February. Anyway, and from a technical point of view, the downward potential has grown after the pair broke below a daily ascendant trend line, currently offering an immediate short term resistance at 1.4280. Should the pair complete a pullback to the level, but fail to extend above it, the downward potential will increase. In the 4 hours chart the technical indicators have bounced from oversold readings but remain within negative territory while the 20 SMA holds around 1.4310, capping the upside.
Support levels: 1.4220 1.4180 1.4135
Resistance levels: 1.4280 1.4310 1.4360
USD/JPY Current price: 121.06
View Live Chart for the USD/JPY
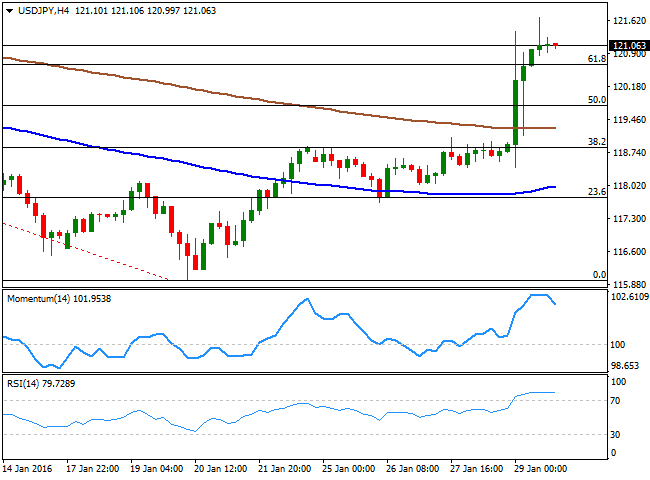
The USD/JPY pair soared during the Asian session, establishing a fresh monthly high of 121.68, underpinned by a JPY sell-off after the BOJ announced fresh stimulus measures. The Bank of Japan not only cut to -0.10% the interbank rate, but also cut its inflation forecast for the fiscal year that begins April 1 to 0.8% from 1.4%. Also, it pushed out to the beginning of the 2017 fiscal year the date when it will reach its 2% inflation target. The pair surged almost 300 pips, and held to most of its gains by the end of the day, closing the week at 121.06. The short term technical picture suggests some consolidation ahead, given that the technical indicators in the 1 hour chart have retreated sharply from overbought levels, but the price remained near its highs. In the 4 hours chart the technical indicators are giving signs of upward exhaustion in extreme overbought territory, yet remain far from suggesting a downward movement, in line with the shorter term perspective. The pair has advanced beyond the 61.8% retracement of the latest daily fall around 120.60. As long as the level holds, bulls will retain control of the pair, with a break above 121.70 opening doors for an advance up to the 123.50 region where the pair will complete a 100% retracement.
Support levels: 120.60 120.15 119.70
Resistance levels: 121.30 121.70 122.10
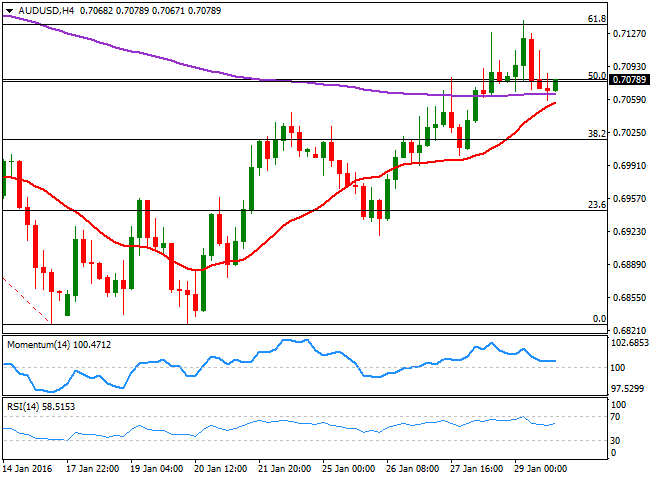
AUD/USD Current price: 0.7078
View Live Chart for the AUD/USD
The Australian dollar enjoyed of firm demand for most of the week, mostly due to oil's recovery. After trading near $26.00 a barrel in the previous week, the black gold surged to near$35.00 a barrel, with both, Brent and WTI ending the week firmly above 30.00. Crude surged on speculation OPEC and non-OPEC oil producers will come to a deal to cut production, albeit the news was later denied. Prices fell, but hold into gains for the week afterwards. As for the Aussie, it will be a big week the upcoming one, as the RBA will have its economic policy meeting, alongside with the release of key macroeconomic indicators, including the latest Manufacturing PMI. The pair traded as high as 0.7140 last Friday, ending the week at 0.7078, around the 50% retracement of its latest daily decline. For this Monday, the pair retains a positive tone, as in the 4 hours chart, the price has managed to hold above a horizontal 200 EMA, currently around 0.7060, while the 20 SMA has steadily advance, now holding a handful of pips below that level. In the same chart, the technical indicators have retreated from overbought readings, but held above their mid-lines and are now turning higher, in line with some further gains, particularly on a recovery above, 0.7100.
Support levels: 0.7060 0.7020 0.6980
Resistance levels: 0.7105 0.7150 0.7190
Information on these pages contains forward-looking statements that involve risks and uncertainties. Markets and instruments profiled on this page are for informational purposes only and should not in any way come across as a recommendation to buy or sell in these assets. You should do your own thorough research before making any investment decisions. FXStreet does not in any way guarantee that this information is free from mistakes, errors, or material misstatements. It also does not guarantee that this information is of a timely nature. Investing in Open Markets involves a great deal of risk, including the loss of all or a portion of your investment, as well as emotional distress. All risks, losses and costs associated with investing, including total loss of principal, are your responsibility. The views and opinions expressed in this article are those of the authors and do not necessarily reflect the official policy or position of FXStreet nor its advertisers. The author will not be held responsible for information that is found at the end of links posted on this page.
If not otherwise explicitly mentioned in the body of the article, at the time of writing, the author has no position in any stock mentioned in this article and no business relationship with any company mentioned. The author has not received compensation for writing this article, other than from FXStreet.
FXStreet and the author do not provide personalized recommendations. The author makes no representations as to the accuracy, completeness, or suitability of this information. FXStreet and the author will not be liable for any errors, omissions or any losses, injuries or damages arising from this information and its display or use. Errors and omissions excepted.
The author and FXStreet are not registered investment advisors and nothing in this article is intended to be investment advice.
Recommended Content
Editors’ Picks

EUR/USD trades firmer near 1.0350 as traders brace for German Retail Sales, FOMC Minutes
The EUR/USD pair gains ground to near 1.0350 during the early European session on Wednesday. However, the potential upside of the major pair might be limited amid the prospects for slower interest rate cuts by the Federal Reserve in 2025.
GBP/USD hovers below nine-day EMA near 1.2500
The GBP/USD pair maintains its position after registering losses in the previous session, hovering around 1.2480 during Wednesday's Asian hours. Technical analysis on the daily chart points to a weakening bearish trend, as the pair is trading above the upper boundary of a descending channel pattern.

Gold eyes US ADP report and Fed Minutes for next push higher
Gold price is consolidating the previous rebound near $2,650 early Wednesday, awaiting the US ADP jobs report and the Minutes of the US Federal Reserve December meeting for the next leg higher.

DOGE and SHIB traders book profits at the top
Dogecoin and Shiba Inu prices broke below their key support levels on Wednesday after declining more than 9% the previous day. On-chain data provider Santiments Network Realized Profit/Loss indicator shows massive spikes in these dog-theme memecoins, indicating traders realize profits.
Five fundamentals for the week: Nonfarm Payrolls to keep traders on edge in first full week of 2025 Premium
Did the US economy enjoy a strong finish to 2024? That is the question in the first full week of trading in 2025. The all-important NFP stand out, but a look at the Federal Reserve and the Chinese economy is also of interest.

Best Forex Brokers with Low Spreads
VERIFIED Low spreads are crucial for reducing trading costs. Explore top Forex brokers offering competitive spreads and high leverage. Compare options for EUR/USD, GBP/USD, USD/JPY, and Gold.
