EUR/USD Current Price: 1.0946
View Live Chart for the EUR/USD
The EUR/USD pair managed to close its fourth day with gains, helped by poor US Durable Goods Order data, ahead of the release of GDP figures this Friday, and in spite of higher crude prices that if anything, halted the advance of the common currency. Plenty of data was released this Thursday, with the most relevant being German inflation up in January to 0.5% YoY, from 0.3% in December, on the back of higher food prices. On the month, German prices dropped by 0.8%, matching expectations. In the EU the economic sentiment index for February resulted at 105.0, below the expected 106.4. But the star of the day was indeed US Durable Goods Orders, much worse-than-expected as monthly basis it fell by 5.1%, while the US weekly unemployment claims came out at 278K for the week ending Jan 22. Crude prices were also in the eye of the storm, with WTI up to $34.80 a barrel before retreating towards $33.00 by the end of the day.
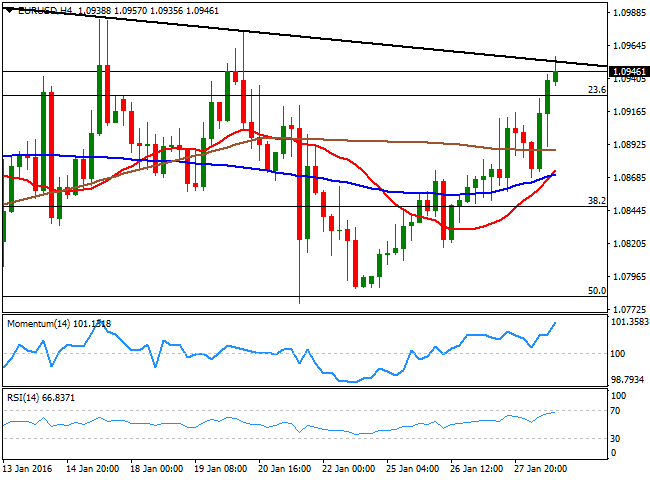
The EUR/USD holds near a daily high set at 1.0957, where a daily descendant trend line coming from December high, finally halted the advance. The technical picture for the pair shows that it is at a brink of breaking higher, given that its ending the day above a Fibonacci level, and it's also above its 100 DMA, closing above it for the first time since last October. Short term, the 1 hour chart shows that the technical indicators hover near overbought levels, while the 20 SMA heads north around the 1.0900 figure, acting as an intraday support. In the 4 hours chart, the price has moved away from its moving averages, while the Momentum indicator presents a clear upward slope, supporting additional advances, particularly on an upward acceleration above 1.0960.
Support levels: 1.0930 1.0900 1.0860
Resistance levels: 1.0960 1.1000 1.1045
EUR/JPY Current price: 129.43
View Live Chart for the EUR/JPY
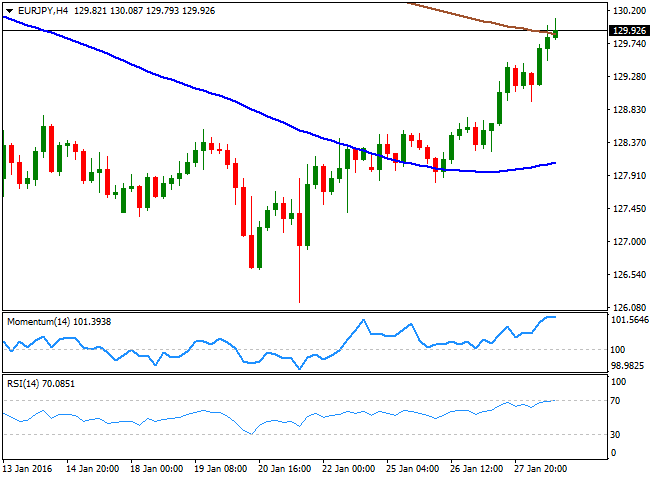
The EUR/JPY pair traded briefly above 130.00 for the first time in over three weeks, with the Japanese yen weighed by an improved market sentiment and rising oil prices. Another reason of Japanese yen's weakness comes from speculation, or better said, hopes that the BOJ will announce some additional form of stimulus during the economic policy meeting early Friday. Technically, the 1 hour chart shows that the price has been steadily advancing above a now bullish 100 SMA, while the Momentum indicator heads north in positive territory, and the RSI indicator hovers around 72. In the 4 hours chart, the technical indicators are beginning to look exhausted in overbought territory, but are far from suggesting a downward move ahead, while the price is hovering around its 200 SMA, and near its daily highs, suggesting the risk remains towards the upside.
Support levels: 129.60 129.10 128.50
Resistance levels: 130.10 130.45 130.90
GBP/USD Current price: 1.4317
View Live Chart for the GBP/USD
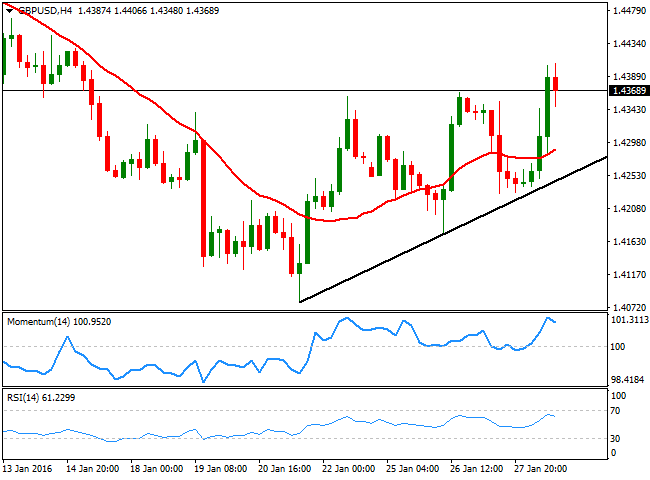
The British Pound is still having a hard time when it comes to recover ground against the greenback, although the pair advanced up to 1.4406 this Thursday, helped by the release of the first estimate of the UK Q4 2015 GDP that came in at 0.5%, in line with the consensus forecast and above previous quarter reading of 0.4%. The report also showed that the services sector continues to lead the economic advance, whilst manufacturing remained flat, still a drag. From a technical perspective, the pair is looking painfully bullish, as intraday rallies continue to attract selling interest. Nevertheless, higher highs are seen whilst a daily ascendant trend line coming from 1.0478 contains the downside. Short term, the 1 hour chart shows that the technical indicators have lost upward strength, now flat near overbought levels, while the price is above a bullish 20 SMA. In the 4 hours chart, the technical indicators have turned lower from overbought levels, but the price remains above a bullish 20 SMA. Renewed buying interest beyond 1.4400, should see the rally extending, particularly if oil continues recovering ground.
Support levels: 1.4360 1.4310 1.4270
Resistance levels: 1.4400 1.4440 1.4485
USD/JPY Current price: 118.60
View Live Chart for the USD/JPY
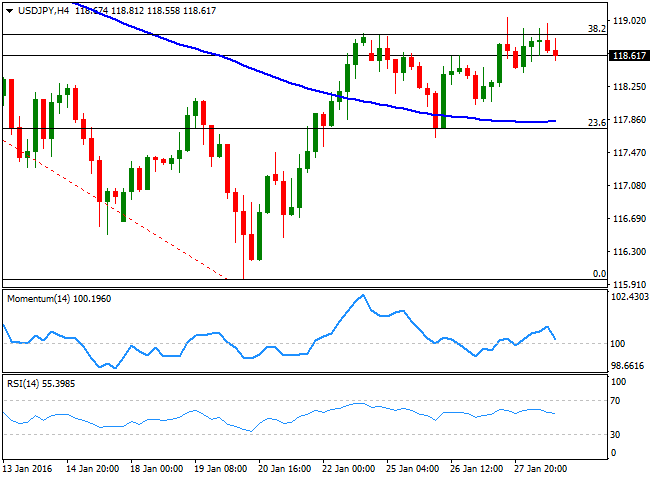
The USD/JPY pair traded around the 118.90 Fibonacci level for most of the day, with attempts to advance beyond it resulting in limited retraces. Even the release of disappointing US data was not enough to boost the yen, as investors are waiting for the BOJ's economic policy decision during the upcoming session, before establishing positions. Japan will also release its Tokyo and National CPI figures ahead of the meeting, generally expected to remain subdued. Short term, the 1 hour chart shows that the price has been confined to a tight intraday range above its 100 SMA, the immediate support now around 1118.50. In the same chart, the technical indicators have turned south around their mid-lines, lacking directional strength at the time being. In the 4 hours chart, the pair is halfway between its moving averages, while the technical indicators have turned south, but remain above their mid-lines. The JPY may likely appreciate if the BOJ remains on hold, with a break below 118.10 opening doors for a steady decline on Friday.
Support levels: 118.50 118.10 117.70
Resistance levels: 118.90 119.35 119.70
AUD/USD Current price: 0.7082
View Live Chart for the AUD/USD
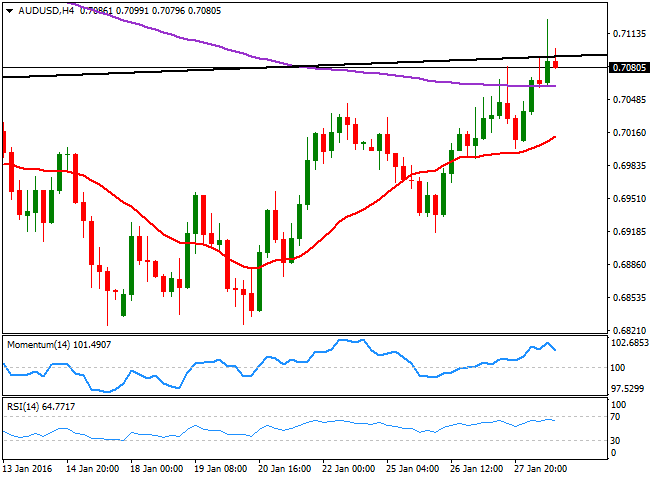
The AUD/USD pair traded as high as 0.7127, with commodity currencies underpinned by rising oil prices. The Aussie however, retreated from its high and trades against the greenback, right below the daily ascendant trend line broken late December. Only time will tell if the latest recovery has been a pullback to it, or if an interim bottom has taken place. Australia will release its PPI data for the last quarter of 2015 during the upcoming hours, and a soft number may affect the currency. Nevertheless, is expected to remain strong ahead of the RBA economic policy meeting next week. In the meantime, the 1 hour chart shows that the technical indicators are posting lower lows and head south within positive territory, while the 20 SMA heads higher around 0.7060, providing an immediate short term support. In the 4 hours chart, the technical indicators are also turning south from overbought territory, but the pair holds above its 200 EMA and the 20 SMA this last with a strong bullish slope, all of which maintains the risk towards the downside limited.
Support levels: 0.7060 0.7020 0.6980
Resistance levels: 0.7110 0.7150 0.7190
Information on these pages contains forward-looking statements that involve risks and uncertainties. Markets and instruments profiled on this page are for informational purposes only and should not in any way come across as a recommendation to buy or sell in these assets. You should do your own thorough research before making any investment decisions. FXStreet does not in any way guarantee that this information is free from mistakes, errors, or material misstatements. It also does not guarantee that this information is of a timely nature. Investing in Open Markets involves a great deal of risk, including the loss of all or a portion of your investment, as well as emotional distress. All risks, losses and costs associated with investing, including total loss of principal, are your responsibility. The views and opinions expressed in this article are those of the authors and do not necessarily reflect the official policy or position of FXStreet nor its advertisers. The author will not be held responsible for information that is found at the end of links posted on this page.
If not otherwise explicitly mentioned in the body of the article, at the time of writing, the author has no position in any stock mentioned in this article and no business relationship with any company mentioned. The author has not received compensation for writing this article, other than from FXStreet.
FXStreet and the author do not provide personalized recommendations. The author makes no representations as to the accuracy, completeness, or suitability of this information. FXStreet and the author will not be liable for any errors, omissions or any losses, injuries or damages arising from this information and its display or use. Errors and omissions excepted.
The author and FXStreet are not registered investment advisors and nothing in this article is intended to be investment advice.
Recommended Content
Editors’ Picks

EUR/USD clings to strong daily gains near 1.0400
EUR/USD remains on track to post strong gains despite retreating from the session high it set above 1.0430. The positive shift in risk mood, as reflected by the bullish action seen in Wall Street, forces the US Dollar to stay on the back foot and helps the pair hold its ground.
GBP/USD surges above 1.2500 as risk flows dominate
GBP/USD extends its recovery from the multi-month low it set in the previous week and trades above 1.2500. The improving market sentiment on easing concerns over Trump tariffs fuelling inflation makes it difficult for the US Dollar (USD) to find demand and allows the pair to stretch higher.

Gold firmer above $2,630
Gold benefits from the broad-based US Dollar weakness and recovers above $2,630 after falling to a daily low below $2,620 in the early American session on Monday. Meanwhile, the benchmark 10-year US Treasury bond yield holds above 4.6%, limiting XAU/USD upside.

Bitcoin Price Forecast: Reclaims the $99K mark
Bitcoin (BTC) trades in green at around $99,200 on Monday after recovering almost 5% in the previous week. A 10xResearch report suggests BTC could approach its all-time high (ATH) of $108,353 ahead of Trump’s inauguration.
Five fundamentals for the week: Nonfarm Payrolls to keep traders on edge in first full week of 2025 Premium
Did the US economy enjoy a strong finish to 2024? That is the question in the first full week of trading in 2025. The all-important NFP stand out, but a look at the Federal Reserve and the Chinese economy is also of interest.

Best Forex Brokers with Low Spreads
VERIFIED Low spreads are crucial for reducing trading costs. Explore top Forex brokers offering competitive spreads and high leverage. Compare options for EUR/USD, GBP/USD, USD/JPY, and Gold.
