EUR/USD Current Price: 1.0891
View Live Chart for the EUR/USD
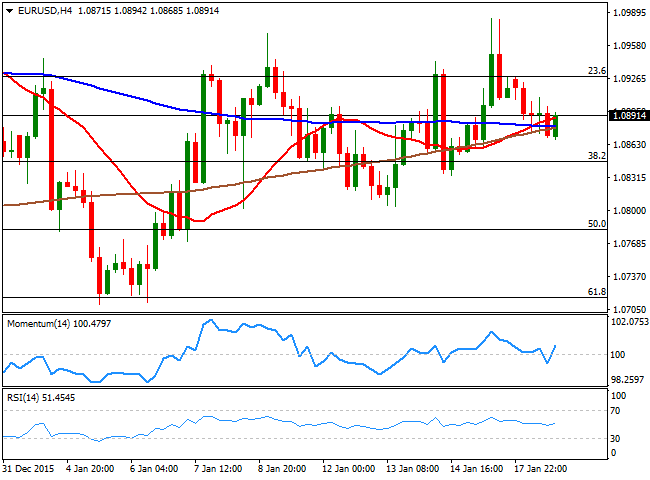
The EUR/USD pair wavered around the 1.0900 level this Monday, unable to find direction as, following an empty calendar during the European session, US markets remained closed on holidays, in observance of the Martin Luther King day. Still, risk aversion continued dominating the financial world, this time, triggered by Iran as during the weekend, international sanctions over Iran were lifted, and now the country will be able to add as much as 500,000 barrels a day to crude exports, sending the commodity down to fresh 12-year lows. Also in the spotlight is the upcoming ECB meeting later this week, with market's expectations pointing to a dovish stance from Mr. Draghi, as the Central Bank measures are still unable to revive the local economy.
Technically, the pair maintains quite a neutral stance, as the 4 hours chart shows that the 20,100 and 200 SMA's converge in a 10-pips range, whilst the technical indicators moved back and forth around their mid-lines ever since the day started. Pretty much, the EUR/USD pair has lacked directional strength ever since the upward rally triggered by the ECB earlier December, with a decline down to 1.0700 having been quickly corrected higher. Sellers are still surging around the 1.1000 figure, although 1.1060 is still the level to break to confirm a more sustainable bullish continuation, while the line in the sand towards the downside comes at 1.0800, where buying interest has been surging for most of these last two weeks.
Support levels: 1.0845 1.0800 1.0760
Resistance levels: 1.0925 1.0965 1.1000
EUR/JPY Current price: 127.83
View Live Chart for the EUR/JPY
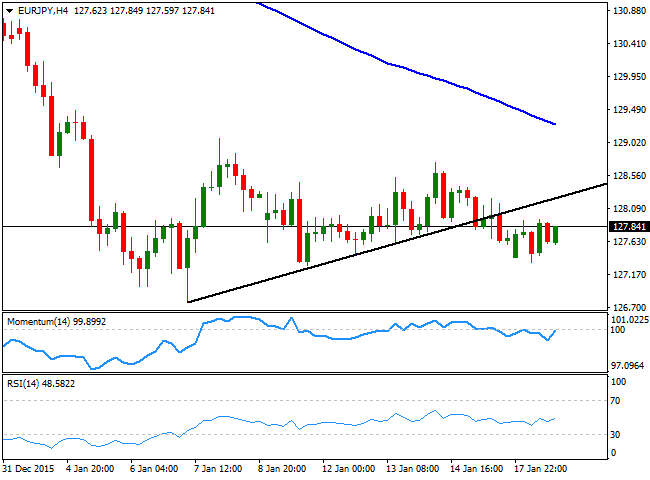
The EUR/JPY pair added some 20 pips this Monday, but not before posting a lower low daily basis at 127.33. The Japanese yen was generally lower across the board after BoJ's Governor Kuroda repeated that the domestic economy is likely to continue recovering at a moderate pace, whilst reiterating that aggressive easing is still on the cards to achieve and maintain its 2% inflation target. Anyway, the common currency failed to attract buying interest leaving the pair confined in a tight intraday range. Technically and for the short term, the 1 hour chart shows that the 100 and 200 SMAs converge around the 128.00 level, acting as an immediate dynamic resistance, although the technical indicators aim slightly higher above their mid-lines. In the 4 hours chart, however, the upside remains quite limited, given that the technical indicators lack directional strength around their mid-lines, whilst the price continues developing far below a sharply bearish 100 SMA.
Support levels: 127.30 126.75 126.20
Resistance levels: 128.00 128.55 129.00
GBP/USD Current price: 1.4257
View Live Chart for the GBP/USD
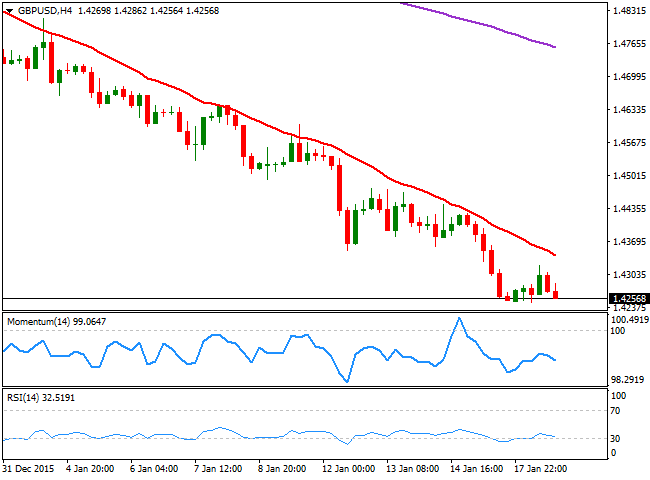
The British Pound attempted to correct higher against its American rival this Monday, but failed miserably to sustain gains, and trades a handful of pips above a fresh multi-year low established at 1.4247 during the European session. A minor housing report released earlier in the day showed that the Rightmove house price index improved in January, up to 0.5% from a previous -1.1%. But concerns over a possible Brexit and concerns over an economic setback in the UK are keeping the Pound under pressure. The rally seems way overextended, considering that the pair has fallen for three weeks in a row, with almost no upward corrective movements in between, yet the technical readings are still favoring the downside as there are no signs the pair will change course any time soon. The 20 SMA in the 4 hours chart has been the main resistance ever since late December, and approaches to it have resulted in renewed selling interest sending prices to new lows, and is currently around 1.4350, the level to break now to confirm an upward corrective move. Nevertheless, the technical indicators in the same time frame have turned back south near oversold readings after a limited upward corrective movement, maintaining the risk towards the downside. A break below 1.4220, May 2010 low and the immediate support, should only fuel the slide and favor an approach to the 1.4100 figure for later this week.
Support levels: 1.4220 1.4185 1.4140
Resistance levels: 1.4295 1.4350 1.4390
USD/JPY Current price: 117.33
View Live Chart for the USD/JPY
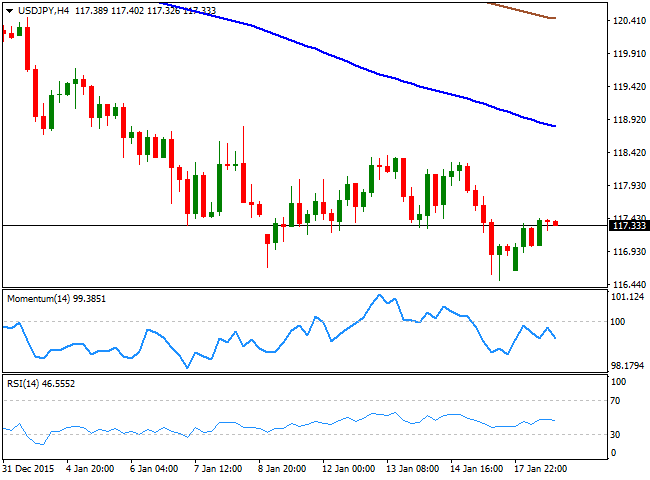
The dollar edged higher against the yen during Asia trade this Monday, following a recovery in Tokyo stocks from a fresh 1-year low. The safe haven currency was also affected by BOJ's Kuroda wording, as the Central Bank's head reaffirmed that they are willing to add more easing in order to achieve the 2.0% inflation target. The dollar held to its intraday gains, with the USD/JPY ending the day around 117.30, a handful of pips below the daily high set a 117.43. Nor Japan, neither the US, will release relevant macro data this Tuesday, which means that the pair can continue trading on sentiment, and the main trigger will be Chinese GDP for the Q4, to be released during the upcoming Asian session. If the number misses expectations the yen and the gold, are likely to gain on their safe haven condition. Technically, the pair maintains its negative tone, as in the 1 hour chart, the price develops well below its 100 and 200 SMAs, while the technical indicators lack directional strength within neutral territory. In the 4 hours chart, the technical indicators have turned sharply lower after failing to overcome their mid-lines, as the price continues developing well below a strongly bearish 100 SMA, supporting the shorter term view and favoring a new leg south for this Tuesday.
Support levels: 116.90 116.50 116.10
Resistance levels: 117.40 117.75 118.10
AUD/USD Current price: 0.6857
View Live Chart for the AUD/USD
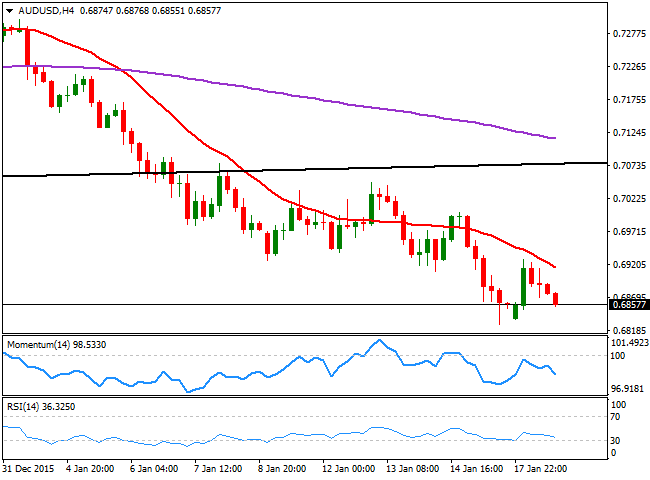
The Aussie enjoyed from some temporal demand at the beginning of the week, helped by a private gauge of inflation in Australia, which showed an advance in prices in December, up to 2.0% yearly basis compared to a previous estimate of 1.8%. The AUD/USD pair advanced up to 0.6927 before retreating on broad dollar's strength during the European and American sessions, and trades now near its recent lows having erased all of its intraday gains. The upcoming direction for the pair will depend on the result of the Chinese Q4 GDP result, expected at 1.7% QoQ and at 6.8% YoY. A better-than-expected outcome can see the pair advancing up to the 0.7000 psychological figure, yet bad numbers should lead to a break below 0.6826, last week low. Technically speaking the downside is still favored given that in the 4 hours chart, the price has accelerated below a bearish 20 SMA, while the technical indicators head sharply lower below their mid-lines, after failing to gain positive territory.
Support levels: 0.6825 0.6780 0.6735
Resistance levels: 0.6905 0.6960 0.7000
Information on these pages contains forward-looking statements that involve risks and uncertainties. Markets and instruments profiled on this page are for informational purposes only and should not in any way come across as a recommendation to buy or sell in these assets. You should do your own thorough research before making any investment decisions. FXStreet does not in any way guarantee that this information is free from mistakes, errors, or material misstatements. It also does not guarantee that this information is of a timely nature. Investing in Open Markets involves a great deal of risk, including the loss of all or a portion of your investment, as well as emotional distress. All risks, losses and costs associated with investing, including total loss of principal, are your responsibility. The views and opinions expressed in this article are those of the authors and do not necessarily reflect the official policy or position of FXStreet nor its advertisers. The author will not be held responsible for information that is found at the end of links posted on this page.
If not otherwise explicitly mentioned in the body of the article, at the time of writing, the author has no position in any stock mentioned in this article and no business relationship with any company mentioned. The author has not received compensation for writing this article, other than from FXStreet.
FXStreet and the author do not provide personalized recommendations. The author makes no representations as to the accuracy, completeness, or suitability of this information. FXStreet and the author will not be liable for any errors, omissions or any losses, injuries or damages arising from this information and its display or use. Errors and omissions excepted.
The author and FXStreet are not registered investment advisors and nothing in this article is intended to be investment advice.
Recommended Content
Editors’ Picks

AUD/USD: Gains remain capped below 0.6500 after soft Australian CPI data
AUD/USD consolidates the latest uptick below 0.6500 in Wednesday's Asian trading, capitalizing on a modest optimism and a broad US Dollar weakness. The upside, however, remains capped by the softer Australian CPI inflation data for October. US data are next in focus.

USD/JPY stays pressured below 153.00, US data eyed
USD/JPY declines to over a two-week low below 153.00 early Wednesday as Trump's tariff threats continue to drive haven flows into the Japanese Yen. However, doubts over the BoJ's ability to tighten its monetary policy further should cap the USD/JPY downside ahead of US data.

Gold: Bear Cross cautions XAU/USD buyers ahead of US inflation test
Gold price has found fresh demand, looking to extend the previous rebound toward $2,650 in Wednesday's Asian trading. The ongoing US Dollar weakness and sluggish US Treasury bond yields allow Gold price to gain traction amid a cautiously optimistic market mood. US data awaited for fresh impetus.

Ripple's XRP sees decline as realized profits reach record levels
Ripple's XRP is down 6% on Tuesday following record profit-taking among investors as its percentage of total supply in profit reached very high levels in the past week.

Eurozone PMI sounds the alarm about growth once more
The composite PMI dropped from 50 to 48.1, once more stressing growth concerns for the eurozone. Hard data has actually come in better than expected recently – so ahead of the December meeting, the ECB has to figure out whether this is the PMI crying wolf or whether it should take this signal seriously. We think it’s the latter.

Best Forex Brokers with Low Spreads
VERIFIED Low spreads are crucial for reducing trading costs. Explore top Forex brokers offering competitive spreads and high leverage. Compare options for EUR/USD, GBP/USD, USD/JPY, and Gold.
