EUR/USD Current Price: 1.0856
View Live Chart for the EUR/USD
Risk aversion eased further this Wednesday, with the dollar gaining ground during the first half of the day, amid a positive surprise coming from Chinese trade surplus, much better-than-expected. Risk sentiment reversed course after the second world's largest economy posted a surplus of CNY382bn, against the 338bn drop expected. Imports fell by 7.6% against a 11.5% decline expected, whilst exports also decrease much less than expected. In Europe, data released was second line one, with the most notable news being Greece moving out of deflation, as the yearly CPI printed 0.4% in December, although it hardly affected the common currency.
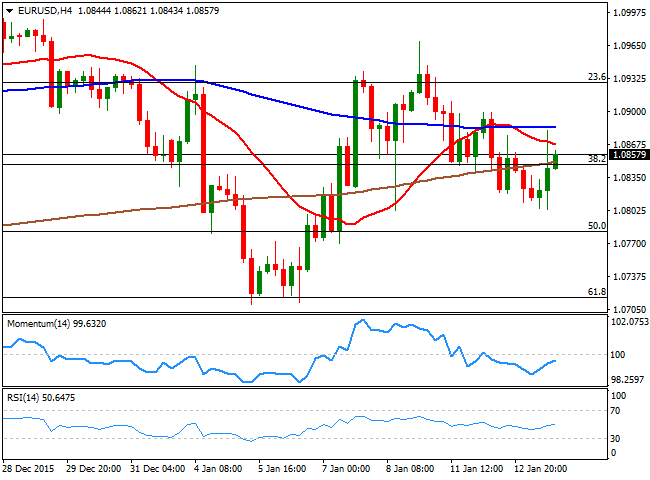
The EUR/USD pair traded as low as 1.0804 ahead of the US opening, as market's positive mood favored the greenback. The pair however, trimmed its intraday losses and advanced up to 1.0881 during the American afternoon, but also failed to sustain gains, ending the day with limited gains in the 1.0850 region. Technically, the pair maintains the neutral stance seen on previous updates, with a slightly positive tone coming from the 1 hour chart as the price is above its 20 SMA and a strong static Fibonacci resistance at 1.0845, the 38.2% retracement of the December rally. According to the 4 hours chart, the upside remains limited, with the price unable to establish above a bearish 20 SMA, and the technical indicators losing their upward potential within negative territory.
Support levels: 1.0845 1.0800 1.0750
Resistance levels: 1.0880 1.0925 1.0950
EUR/JPY Current price: 128.09
View Live Chart for the EUR/JPY
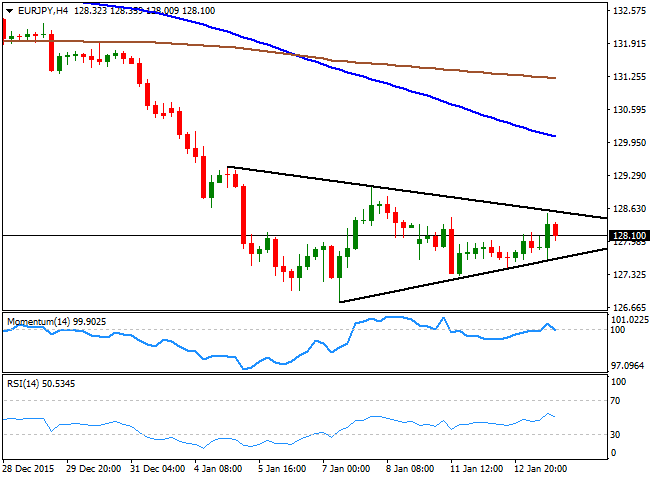
The EUR/JPY pair advanced this Wednesday as improving market's sentiment resulted in a weakening JPY, while the EUR attract buying interest when falling down to the 1.0800 region against the greenback. The short term picture for the pair however, signals an ongoing consolidative strange, given that the price has remained contained within the limits of a symmetrical triangle. In the 1 hour chart, the price has met selling interest around a bearish 200 SMA, a few pips below the roof of the figure, while currently struggles around its 100 SMA and the technical indicators head slightly lower around their mid-lines. In the 4 hours chart, the price remains well below a strongly bearish 20 SMA, while the technical indicators turned lower around their mid-lines, lacking certain directional strength at the time being. The base of the figure stands at 127.50 for today, now the immediate support, with a break below it most likely signaling a strong bearish continuation for this Thursday.
Support levels: 127.50 127.15 126.60
Resistance levels: 128.55 129.05 129.50
GBP/USD Current price: 1.4442
View Live Chart for the GBP/USD
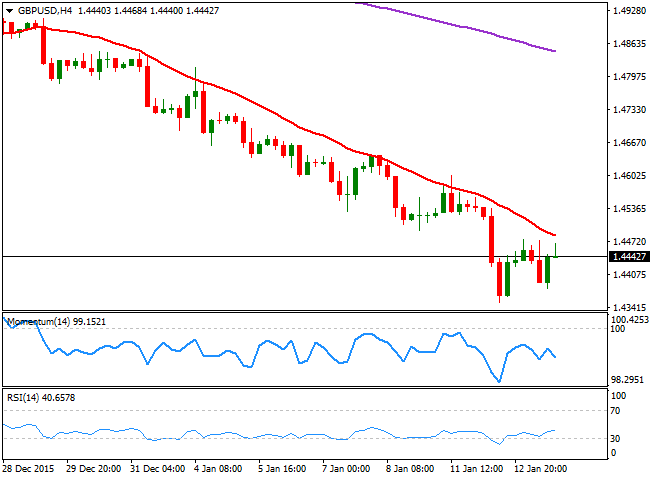
The GBP/USD pair spent the last 24 hours consolidating within the lower half of Tuesday's daily range, with investors still strongly bearish on Pound, but pausing their selling ahead of the Bank of England upcoming economic policy meeting. Once again, the BOE will have a "Super Thursday" with the Central Bank announcing its latest decision on rates and facilities, alongside with the release of the Minutes of the meeting. So far, and considering the Bank has kept its policy steady for years now, the "Super Thursdays" have been anything but super, mostly a non-event. Nevertheless, an increasingly dovish tone suggests the Central Bank will maintain the status quo for longer-than-expected, resulting in a continuously bearish Pound. Short term, the 1 hour chart keeps the downside favored, with the price now struggling around a horizontal 20 SMA, and the technical indicators turning lower below their mid-lines. In the 4 hours chart, the 20 SMA maintains a strong bearish slope above the current level, now offering a strong dynamic resistance around 1.4485, while the technical indicators have turned south well below their mid-lines, after correcting the oversold readings reached earlier this week, supporting a retest of the 1.4350 level, en route to 1.4250.
Support levels: 1.4410 1.4380 1.4350
Resistance levels: 1.4485 1.4520 1.4560
USD/JPY Current price: 117.90
View Live Chart for the USD/JPY
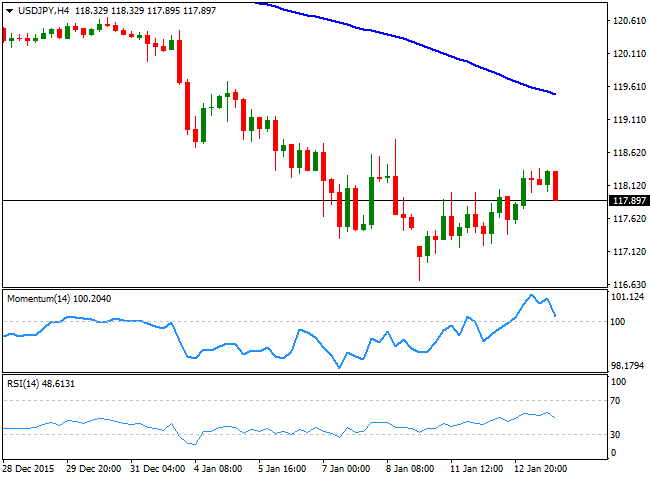
The American dollar advanced up to 118.37 against the Japanese yen, as the market dropped demand for safe havens, at least temporally, following the release of better-than-expected Chinese data during the Asian session. The pair spent most of the day consolidating in a tight range above the 118.00 figure, but finally broke lower as market's sentiment deteriorated in the American afternoon, with Wall Street turning sharply lower as WTI plummeted again towards $30.00 a barrel. The 1 hour chart for the USD/JPY suggests that the pair is poised to extend its decline now, as the price is pressuring the 100 SMA, the immediate support around 117.80, while the technical indicators head south below their mid-lines. In the 4 hours chart the 100 and 200 SMAs, maintain their strong bearish slopes far above the current level, while the technical indicators have turned strongly lower and point to cross their mid-lines towards the downside, in line with the shorter term outlook.
Support levels: 117.80 117.30 1116.90
Resistance levels: 118.40 118.95 119.35
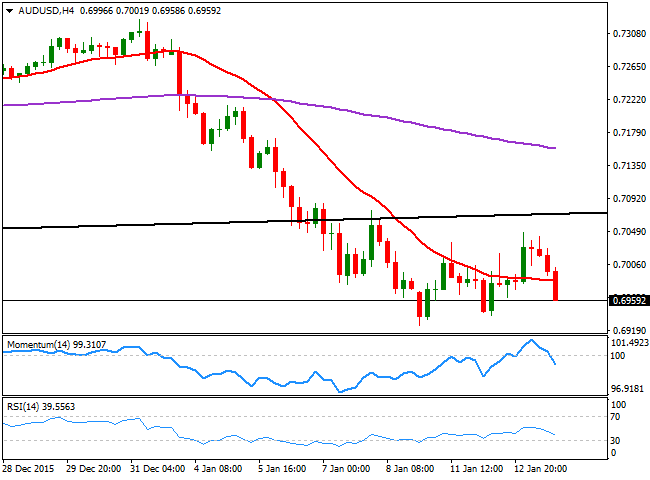
AUD/USD Current price: 0.6958
View Live Chart for the AUD/USD
The Aussie posted a short lived, relief rally, advancing against the greenback up to 0.7048, on the back of positive Chinese data and some aggressive action from the PBoC over the value of the CNY. Nevertheless, China's turmoil is far from over, and will have a lot more saying in the value of currencies this year. The Australian dollar's momentum faded in the American afternoon, and the AUD/USD pair plummeted alongside with equities and oil, and trades at fresh lows in the 0.6950 region ahead of the release of Australian monthly employment data for December. Expectations are of an uptick in the unemployment rate to 5.9% against previous 5.8%, while the economy is expected to have lost 12.5K jobs. Should the data result better than this previews, the Aussie may recover back some ground, but the latest price's behavior suggest selling interest is likely to surge on higher levels. From a technical point of view, the short term picture is bearish, as in the 1 hour chart, the price is well below its 20 SMA while the technical indicators are hovering near oversold readings. In the 4 hours chart, the Momentum indicator heads sharply lower, while the RSI indicator accelerates south around 38 and the price extends below a horizontal 20 SMA, all of which supports some further declines for the upcoming sessions.
Support levels: 0.6955 0.6905 0.6870
Resistance levels: 0.7000 0.7040 0.7075
Information on these pages contains forward-looking statements that involve risks and uncertainties. Markets and instruments profiled on this page are for informational purposes only and should not in any way come across as a recommendation to buy or sell in these assets. You should do your own thorough research before making any investment decisions. FXStreet does not in any way guarantee that this information is free from mistakes, errors, or material misstatements. It also does not guarantee that this information is of a timely nature. Investing in Open Markets involves a great deal of risk, including the loss of all or a portion of your investment, as well as emotional distress. All risks, losses and costs associated with investing, including total loss of principal, are your responsibility. The views and opinions expressed in this article are those of the authors and do not necessarily reflect the official policy or position of FXStreet nor its advertisers. The author will not be held responsible for information that is found at the end of links posted on this page.
If not otherwise explicitly mentioned in the body of the article, at the time of writing, the author has no position in any stock mentioned in this article and no business relationship with any company mentioned. The author has not received compensation for writing this article, other than from FXStreet.
FXStreet and the author do not provide personalized recommendations. The author makes no representations as to the accuracy, completeness, or suitability of this information. FXStreet and the author will not be liable for any errors, omissions or any losses, injuries or damages arising from this information and its display or use. Errors and omissions excepted.
The author and FXStreet are not registered investment advisors and nothing in this article is intended to be investment advice.
Recommended Content
Editors’ Picks

EUR/USD retreats from tops post-US PCE, back near 1.0540
The bearish sentiment in the US Dollar remains in place and supports EUR/USD's constructive outlook, keeping it in the 1.0540 region after the release of US inflation data, as measured by the PCE, on Wednesday.

GBP/USD recedes to 1.2640 on US PCE data
GBP/USD remains positively oriented in the 1.2640 zone as the Greenback experiences a marked pullback following the PCE inflation release.

Gold remains sidelined near $2,640 following US inflation prints
Gold remains on the positive foot near $2,640 per troy ounce, as US inflation data matched initial estimates in October, while US yields display a negative performance across the curve.

The clock is ticking for France
A French political problem is turning into a problem for financial markets. The budget deficit in France is 6% of GDP, if the planned reforms are not enacted, then the deficit could rise to 7% of GDP next year. This is the level when bond vigilantes start to sniff around.

Eurozone PMI sounds the alarm about growth once more
The composite PMI dropped from 50 to 48.1, once more stressing growth concerns for the eurozone. Hard data has actually come in better than expected recently – so ahead of the December meeting, the ECB has to figure out whether this is the PMI crying wolf or whether it should take this signal seriously. We think it’s the latter.

Best Forex Brokers with Low Spreads
VERIFIED Low spreads are crucial for reducing trading costs. Explore top Forex brokers offering competitive spreads and high leverage. Compare options for EUR/USD, GBP/USD, USD/JPY, and Gold.
