EUR/USD Current price: 1.0815
View Live Chart for the EUR/USD
The common currency fell to its lowest in five weeks against the greenback, during the American afternoon, in quite a wild start of the year. Weak Chinese PMI figures, as the Caixin manufacturing PMI for December resulted at 48.2, the tenth straight monthly contraction spurred risk sentiment earlier in the day, sending equities down, and safe-havens yen and gold sharply higher. The calendar was pretty busy, and began with the release of manufacturing readings in Europe, which showed that the upturn in the manufacturing sector continued in December, as German Markit PMI resulted at 53.2 as well as the EU one, both beating expectations. In Germany, however, the preliminary estimated of annual CPI resulted at 0.3%, well below expected, while monthly basis it turned negative, down to -0.1%.
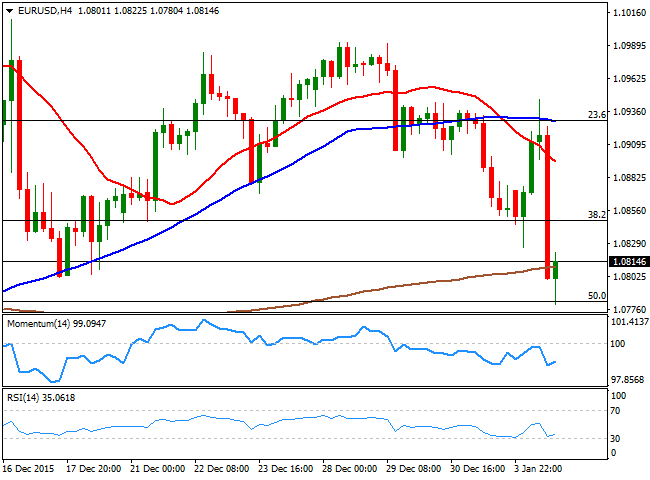
The EUR/USD pair advanced up to 1.0945 as European stocks opened sharply lower, but later turned south, with the dollar rallying, even despite worse-than-expected construction and manufacturing data in the US. According to the latest releases, the ISM Manufacturing PMI shrank to 48.2 from a previous 48.6, while construction spending during November contracted by 0.4%. Overall, the dollar was on demand during the second half of the day, and the pair ends the day in the red, maintaining a short term bearish tone. In the 1 hour chart, the pair is well below its moving averages, while the technical indicators present bearish slopes near oversold readings, supporting some additional declines for the upcoming sessions. In the 4 hours chart, the technical indicators have stalled their declines near oversold levels, but are far from suggesting a stronger upward corrective move. The daily low is also the 50% retracement of the December rally, which means that a break below it, should lead to further declines towards the 1.0700 figure.
Support levels: 1.0780 1.0750 1.0720
Resistance levels: 1.0845 1.0880 1.0915
EUR/JPY Current price: 129.20
View Live Chart for the EUR/JPY
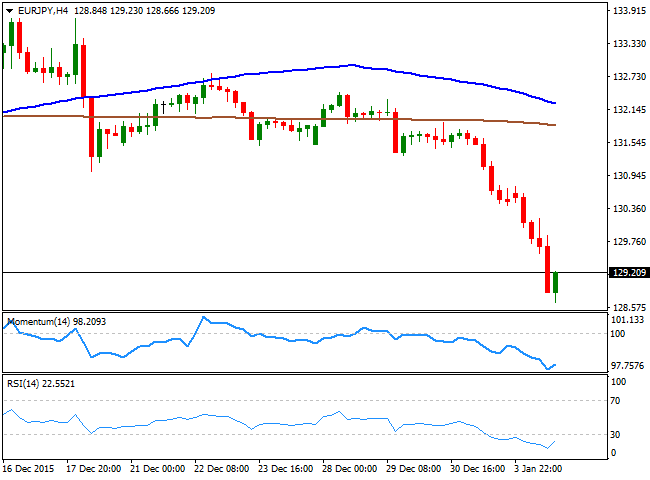
The Japanese yen stands as the daily winner this Monday, having appreciated against all of its major rivals during the Asian session, following the slide in local share markets, and accelerating its advance as stops got triggered. The EUR/JPY fell down to 128.66 its lowest since April 2015, before bouncing some, but the upward move is merely corrective in the middle of the dominant bearish trend. Technically, the 1 hour chart shows that the price has moved further below its 100 and 200 SMAs, now over 200 pips above the current level, while the technical indicators have corrected extreme readings, but remain in oversold territory, maintaining the risk towards the downside. In the 4 hours chart, the technical indicators have lost their bearish strength, but hold in extreme oversold territory, in line with the shorter term view.
Support levels: 128.65 128.20 127.75
Resistance levels: 129.50 129.90 130.40
GBP/USD Current price: 1.4704
View Live Chart for the GBP/USD
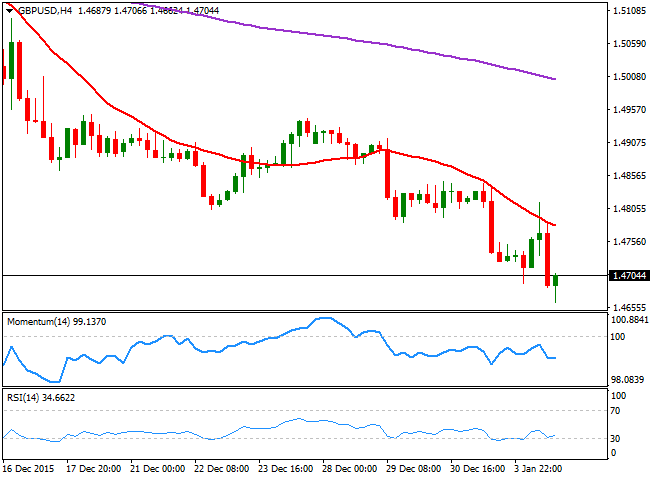
The GBP/USD pair advanced up to 1.4815 intraday, but quickly resumed its decline from the level, as strong selling interest continues dominating the pair. The British Pound was pretty modest compared to other majors this Monday, but anyway extended its decline to lower lows against the greenback, with the pair reaching 1.4662 before bouncing to struggle around the 1.4700 level. Data coming from the UK was again discouraging, given that the manufacturing sector slowed further in December, with the Markit manufacturing PMI printing 51.9 against previous 52.7. Despite the choppy price action the pair fell for a fifth day in-a-row and closed in the red, maintaining the dominant bearish trend intact. Technically, the 1 hour chart shows that the price is currently below a bearish 20 SMA, while the Momentum indicator heads lower within negative territory and the RSI indicator bounces from oversold readings, following price action rather than suggesting a stronger recovery. In the 4 hours chart, the 20 SMA capped the upside during the early advance and maintains a bearish slope, while the technical indicators have turned flat near oversold levels, suggesting some consolidation before a new leg south.
Support levels: 1.4660 1.4620 1.4585
Resistance levels: 1.4755 1.4790 1.4835
USD/JPY Current price: 119.10
View Live Chart for the USD/JPY
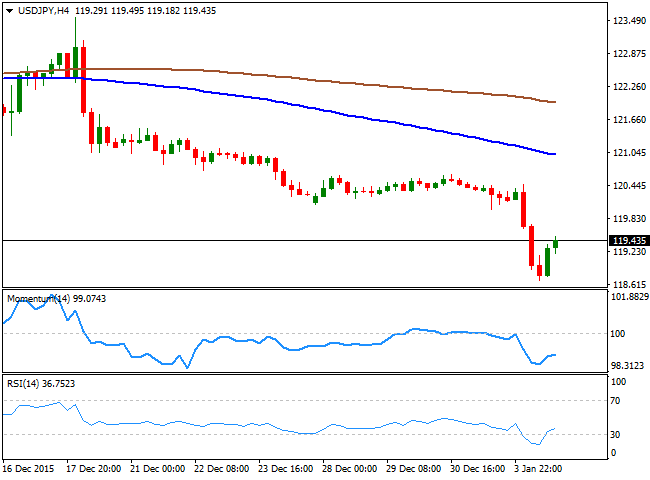
The Japanese yen appreciated against its American rival ever since the day starting, with the pair reaching 118.69 before finally turning higher in the US session, as the dollar recovered its charm. The pair fell to its lowest since mid October, and the former bounce stalled around 119.50, and the 1 hour chart shows that the technical indicators are losing their upward strength below their mid-lines after bouncing from extreme oversold territory, and the RSI indicator is now turning south around 45. In the same chart, the 100 and 200 SMAs maintain their bearish slopes well above the current level, with the shortest capping the upside around 121.00. In the 4 hours chart, the technical indicators turned flat well into negative territory after correcting oversold levels, while the price is also well below its moving averages, all of which maintains the risk towards the downside, with 119.60 being the level to break to see the bearish trend easing during the upcoming sessions.
Support levels: 119.20 118.70 118.35
Resistance levels: 119.60 120.00 120.35
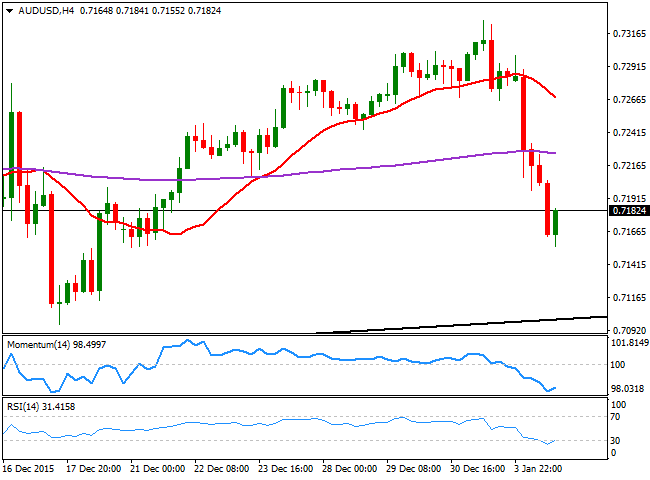
AUD/USD Current price: 0.7182
View Live Chart for the AUD/USD
The Aussie was among the most affected by poor Chinese data, as the commodity-related currency fell to its lowest in two weeks reaching 0.7155 against its American rival before finally bouncing some. Chinese stocks lost 7% reaching the threshold for a trading halt for the rest of the day, which only fueled the negative sentiment towards the Asian currency. Technically speaking, the short term picture still favors the downside, as in the 1 hour chart, the price is well below a strongly bearish 20 SMA, now capping the upside around 0.7205, while the technical indicators have bounced from extreme levels, but are currently losing their upward strength well below their mid-lines. In the 4 hours chart, the latest bounce has helped the technical indicators stalled their declines, but as they remain near oversold readings, the downward risk prevails for the upcoming hours, with a break below 0.7160 required to confirm a new leg south.
Support levels: 0.7160 07130 0.7100
Resistance levels: 0.7205 0.7240 0.7280
Information on these pages contains forward-looking statements that involve risks and uncertainties. Markets and instruments profiled on this page are for informational purposes only and should not in any way come across as a recommendation to buy or sell in these assets. You should do your own thorough research before making any investment decisions. FXStreet does not in any way guarantee that this information is free from mistakes, errors, or material misstatements. It also does not guarantee that this information is of a timely nature. Investing in Open Markets involves a great deal of risk, including the loss of all or a portion of your investment, as well as emotional distress. All risks, losses and costs associated with investing, including total loss of principal, are your responsibility. The views and opinions expressed in this article are those of the authors and do not necessarily reflect the official policy or position of FXStreet nor its advertisers. The author will not be held responsible for information that is found at the end of links posted on this page.
If not otherwise explicitly mentioned in the body of the article, at the time of writing, the author has no position in any stock mentioned in this article and no business relationship with any company mentioned. The author has not received compensation for writing this article, other than from FXStreet.
FXStreet and the author do not provide personalized recommendations. The author makes no representations as to the accuracy, completeness, or suitability of this information. FXStreet and the author will not be liable for any errors, omissions or any losses, injuries or damages arising from this information and its display or use. Errors and omissions excepted.
The author and FXStreet are not registered investment advisors and nothing in this article is intended to be investment advice.
Recommended Content
Editors’ Picks

EUR/USD stabilizes around 1.2550 after hitting two-year lows
EUR/USD plunged to 1.0223, its lowest in over two years, as risk aversion fueled demand for the US Dollar. Thin post-holiday trading exacerbated the movements, with financial markets slowly returning to normal.

USD/JPY flirts with multi-month highs in the 158.00 region
The USD/JPY pair traded as high as 157.84 on Thursday, nearing the December multi-month high of 158.07. Additional gains are on the docket amid prevalent risk aversion.

Gold retains the $2,650 level as Asian traders reach their desks
Gold gathered recovery momentum and hit a two-week-high at $2,660 in the American session on Thursday. The precious metal benefits from the sour market mood and looks poised to extend its advance ahead of the weekly close.

These 5 altcoins are rallying ahead of $16 billion FTX creditor payout
FTX begins creditor payouts on January 3, in agreement with BitGo and Kraken, per an official announcement. Bonk, Fantom, Jupiter, Raydium and Solana are rallying on Thursday, before FTX repayment begins.

Three Fundamentals: Year-end flows, Jobless Claims and ISM Manufacturing PMI stand out Premium
Money managers may adjust their portfolios ahead of the year-end. Weekly US Jobless Claims serve as the first meaningful release in 2025. The ISM Manufacturing PMI provides an initial indication ahead of Nonfarm Payrolls.

Best Forex Brokers with Low Spreads
VERIFIED Low spreads are crucial for reducing trading costs. Explore top Forex brokers offering competitive spreads and high leverage. Compare options for EUR/USD, GBP/USD, USD/JPY, and Gold.
