EUR/USD Current price: 1.0857
View Live Chart for the EUR/USD
The EUR/USD fell at the last trading day of 2015, with the dollar edging broadly higher in thin markets. The common currency has ended the week also in the red, although it managed to gain some ground this December, helped by the surprisingly soft decisions taken by both Central Banks, as the ECB made the slightest extension of QE ever, while the US Federal Reserve pulled the trigger with a largely anticipated 25bp rate raise. Trading volumes have been limited due to the Christmas and New Year's end holidays, and it will take some time to see the market return to its normal. In the meantime, the calendar will be pretty busy this Monday, with the release of the EU manufacturing PMIs, German inflation data and some US manufacturing figures.
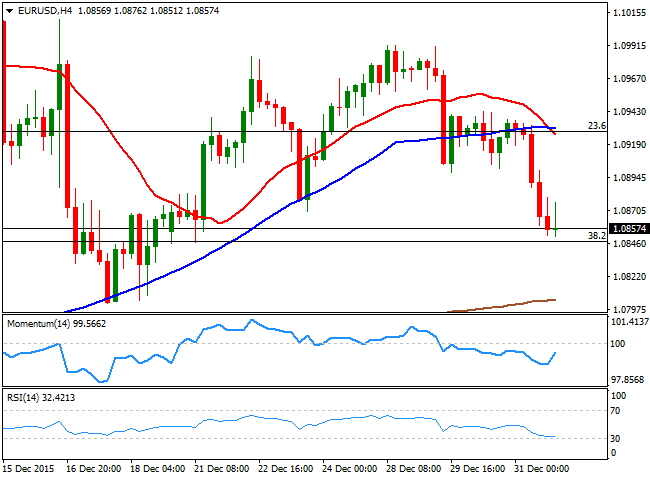
The pair lost the 1.0900 level on Thursday, and fell down to 1.0851 stalling a few pips above the 38.2% retracement of the December bullish run, but the overall stance is bearish, given that the daily chart shows that the price was rejected from its 20 DMA while the technical indicators have gained bearish slopes below their mid-lines. In the same chart, the 100 DMA contained the rally earlier in the month, and presents a limited bearish slope above the shorter one. In the 4 hours chart, the price is below a now bearish 20 SMA that converges with the 23.6% retracement of the same rally in the 1.0930 region, while he technical indicators are aiming to bounce within negative territory, limiting chances of a recovery as long as the price remains below 1.0880 the immediate resistance.
Support levels: 1.0845 1.0800 1.0770
Resistance levels: 1.0880 1.0930 1.0960
EUR/JPY Current price: 130.48
View Live Chart for the EUR/JPY
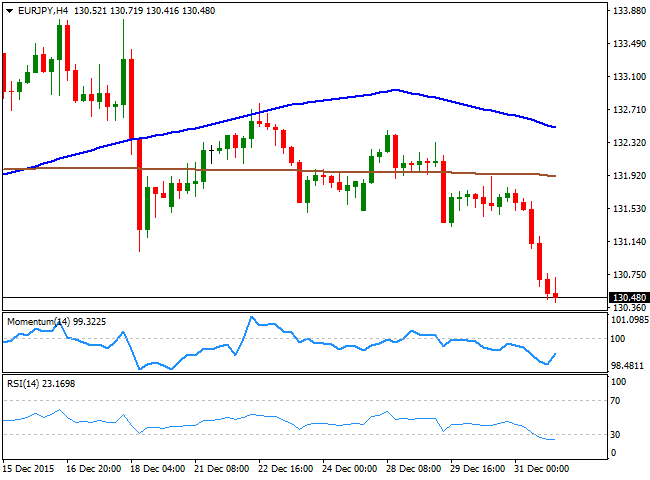
The EUR/JPY pair plummeted on EUR's weakness, with the pair ending the week near the low set at 130.41. With the yen pretty much directionless ever since the year started, the pair was led by EUR self strength, or weakness, for most of this 2015, as the Japanese yen closed the year pretty much unchanged against the greenback. The low for the year was set at 126.08 last April, when the EUR/USD also bottomed at 1.0461, and despite being far from it, the technical setup favors a retest of such low, as in the daily chart the price has extended further below its 100 DMA, whilst the technical indicators have turned sharply lower below their mid-lines. In the shorter term, the 4 hours chart shows that the technical indicators have lost downward strength within negative territory, with the RSI indicator still holding in oversold levels and far from suggesting an upward corrective move, all of which maintains the risk towards the downside.
Support levels: 130.40 129.90 129.50
Resistance levels: 130.70 131.20 131.65
GBP/USD Current price: 1.4732
View Live Chart for the GPB/USD
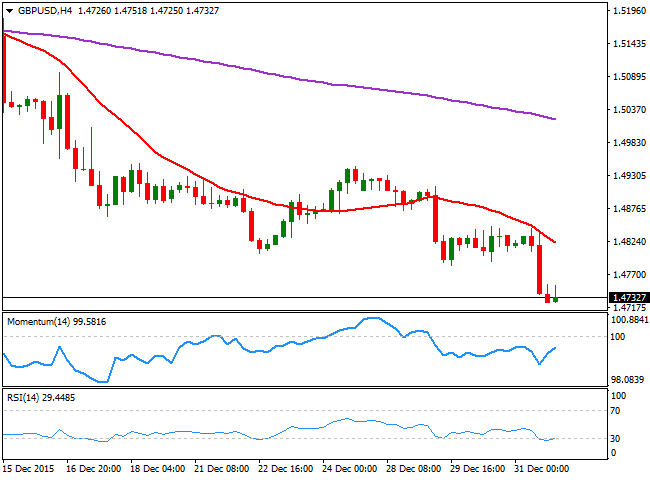
The British Pound was among the biggest losers this December, closing the month against the greenback at a fresh 8-month low set at 1.4725. The movement may have been exacerbated during the last two weeks by the reduced volumes, but the Pound has came under pressure mid last year, when chances of a rate hike got diminished by softening local macroeconomic data. The British currency also suffered lately by mounting speculation over a referendum on remaining within the EU, to be launched this year. But for the most, the GBP/USD plunged as traders unwound their buys taken on confidence on the economic growth. From a technical point of view, the daily chart shows that the price has fallen further below a strongly bearish 20 SMA, while the technical indicators maintain their bearish slopes near oversold territory, all of which supports additional declines. In the 4 hours chart, the price is also well below a bearish 20 SMA while the RSI indicator hovers in oversold territory and the Momentum indicator aims higher, but below 100, pointing for some consolidation ahead of a new leg south.
Support levels: 1.4740 1.4700 1.4660
Resistance levels: 1.4755 1.4790 1.4835
USD/JPY Current price: 120.60
View Live Chart for the USD/JPY
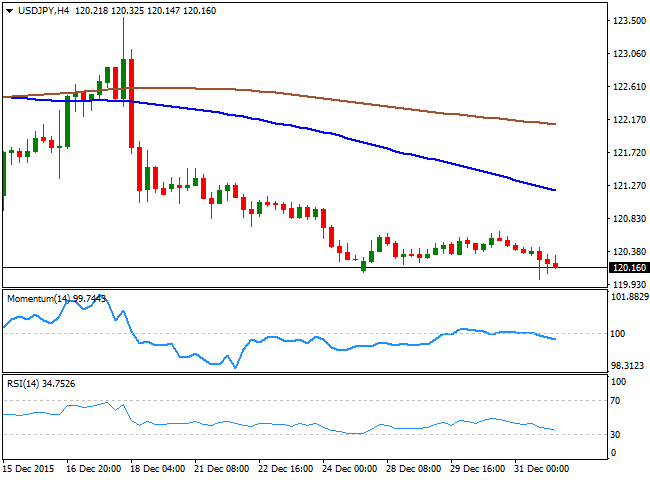
The USD/JPY pair closed the year a handful of pips above its January opening at 119.82, having entered in a long term consolidative stage ever since topping at 125.85 last May. The pair fell late December, as the BOJ surprised markets by announcing some changes in its economic stimulus policies that anyway were short from investors' expectations. The pair traded in a well limited range last week, but the Japanese yen gained against its American rival following plummeting stocks, with US indexes having their worse year since 2008. Technically, the USD/JPY pair continues to present a strong downward potential, albeit buyers have been defending the 120.00 psychological figure. Nevertheless and in the daily chart, the technical indicators have failed to advance beyond their mid-lines and resumed their declines within bearish territory, as the price moved further below its 100 and 200 DMAs, in line with further declines. In the 4 hours chart the technical outlook is also bearish, as the price is well below a strongly bearish 100 SMA, and the technical indicators maintain their bearish slopes below their mid-lines.
Support levels: 120.00 119.60 119.20
Resistance levels: 120.35 120.70 121.10
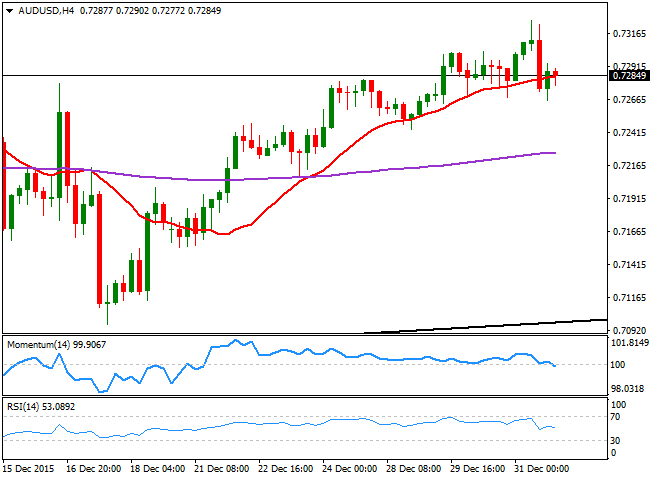
AUD/USD Current price: 0.7284
View Live Chart for the AUD/USD
The AUD/USD pair closed December with gains, right below the 0.7300 figure, although far below its January opening at 0.8171. The pair however, seems to have bottomed at 0.6906 last September, and now trades within a large symmetrical triangle that will likely continue defining the trading range ahead of a clear catalyst. Capping the recovery are commodities prices, which came under pressure on a stronger dollar and an oversupplied oil market, and China's economic slowdown. And this last will likely continue weighing on the Aussie, as over the weekend, the official manufacturing PMI for December came out at 49.7, still in contraction territory and below market's expectations of 49.8. Technically, the AUD/USD daily chart shows that the price is above a flat 20 SMA, but that the Momentum indicator has turned south and is about to cross the 100 level towards the downside, while the RSI indicator lacks directional strength above its mid-line, all of which limits the upside. In the 4 hours chart, the price is stuck around a mild bullish 20 SMA while the technical indicators aim lower around their mid-lines, supporting some limited downward corrective move towards the key 0.7240 support that, if broken, will result in further declines during this Monday.
Support levels: 0.7240 0.7200 0.7160
Resistance levels: 0.7300 0.7330 0.7365
Information on these pages contains forward-looking statements that involve risks and uncertainties. Markets and instruments profiled on this page are for informational purposes only and should not in any way come across as a recommendation to buy or sell in these assets. You should do your own thorough research before making any investment decisions. FXStreet does not in any way guarantee that this information is free from mistakes, errors, or material misstatements. It also does not guarantee that this information is of a timely nature. Investing in Open Markets involves a great deal of risk, including the loss of all or a portion of your investment, as well as emotional distress. All risks, losses and costs associated with investing, including total loss of principal, are your responsibility. The views and opinions expressed in this article are those of the authors and do not necessarily reflect the official policy or position of FXStreet nor its advertisers. The author will not be held responsible for information that is found at the end of links posted on this page.
If not otherwise explicitly mentioned in the body of the article, at the time of writing, the author has no position in any stock mentioned in this article and no business relationship with any company mentioned. The author has not received compensation for writing this article, other than from FXStreet.
FXStreet and the author do not provide personalized recommendations. The author makes no representations as to the accuracy, completeness, or suitability of this information. FXStreet and the author will not be liable for any errors, omissions or any losses, injuries or damages arising from this information and its display or use. Errors and omissions excepted.
The author and FXStreet are not registered investment advisors and nothing in this article is intended to be investment advice.
Recommended Content
Editors’ Picks

EUR/USD extends recovery beyond 1.0400 amid Wall Street's turnaround
EUR/USD extends its recovery beyond 1.0400, helped by the better performance of Wall Street and softer-than-anticipated United States PCE inflation. Profit-taking ahead of the winter holidays also takes its toll.
GBP/USD nears 1.2600 on renewed USD weakness
GBP/USD extends its rebound from multi-month lows and approaches 1.2600. The US Dollar stays on the back foot after softer-than-expected PCE inflation data, helping the pair edge higher. Nevertheless, GBP/USD remains on track to end the week in negative territory.

Gold rises above $2,620 as US yields edge lower
Gold extends its daily rebound and trades above $2,620 on Friday. The benchmark 10-year US Treasury bond yield declines toward 4.5% following the PCE inflation data for November, helping XAU/USD stretch higher in the American session.

Bitcoin crashes to $96,000, altcoins bleed: Top trades for sidelined buyers
Bitcoin (BTC) slipped under the $100,000 milestone and touched the $96,000 level briefly on Friday, a sharp decline that has also hit hard prices of other altcoins and particularly meme coins.

Bank of England stays on hold, but a dovish front is building
Bank of England rates were maintained at 4.75% today, in line with expectations. However, the 6-3 vote split sent a moderately dovish signal to markets, prompting some dovish repricing and a weaker pound. We remain more dovish than market pricing for 2025.

Best Forex Brokers with Low Spreads
VERIFIED Low spreads are crucial for reducing trading costs. Explore top Forex brokers offering competitive spreads and high leverage. Compare options for EUR/USD, GBP/USD, USD/JPY, and Gold.
