EUR/USD Current Price: 1.0926
View Live Chart for the EUR/USD
Oil's recovery paved the way for a turnaround Tuesday, as the commodity surged around 3% from multi-year lows, following Chinese data showing that demand for the commodity in the country will likely hit a record high in 2015, despite ongoing fears over an economic slowdown. The day started with the release of tepid macroeconomic figures in China, which showed that industrial production growth slowed to 5.9% y/y from 6.2%, fixed investment to 8.3% y/y from 10.2%, GDP to 6.8% y/y from 6.9%, and retail sales slowed to 10.7% from 11%. Stocks however, edged higher in Asia, boosting investors' mood. European data was far from shocking, with inflation in the EU matching expectations in December, still within deflationary levels, flat monthly basis, and up by 0.2% compared to a year before. The German ZEW survey showed that economic sentiment continued declining in January down to 10.2 against previous 16.1, albeit above expectations of 8.2. Sentiment in the EU, however, resulted much worse-than-expected in the same month, down to 22.7.
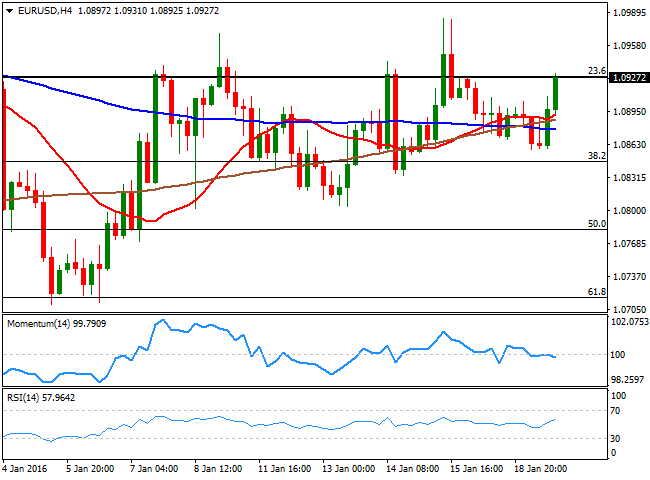
The common currency has finally woke up in the American afternoon, rallying through the 1.0900 level against the greenback after being confined to a tight 40 pips range for most of the day, as Wall Street gave back most of its intraday gains after a positive start. Trading around the 23.6% retracement of its December bullish run, the pair retains the neutral stance seen on previous updates, as the 4 hours chart shows that the price is barely above its moving averages, whilst the technical indicators continue hovering around their mid-lines. The rally may now extend up to 1.0965, the immediate resistance, but selling interest will likely surge near 1.1000, maintaining the pair limited, ahead of Thursday's ECB meeting.
Support levels: 1.0880 1.0845 1.0800
Resistance levels: 1.0965 1.1000 1.1045
EUR/JPY Current price: 128.35
View Live Chart for the EUR/JPY
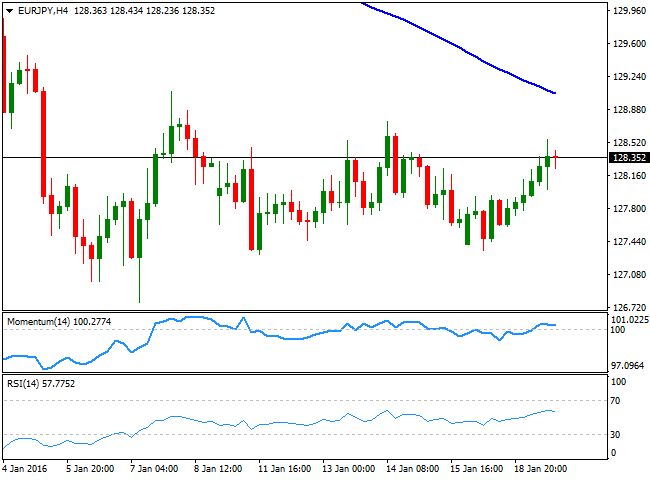
The EUR/JPY pair advanced up to 128.54, helped by a weakening Japanese yen during the first half of the day amid rising stocks, but the rally stalled as both currencies run against the greenback during the American afternoon. The intraday gains are not enough to confirm a sharper turn around in the pair, as in the 1 hour chart, the technical indicators remain directionless in positive territory, while the 100 and 200 SMAs converge flat around 128.00, offering an immediate short term support. In the 4 hours chart, the technical indicators are turning slightly lower within neutral territory, whilst the 100 SMA has extended further lower its decline, now acting as a strong dynamic resistance around 129.00.
Support levels: 128.00 127.70 127.30
Resistance levels: 128.55 129.00 129.40
GBP/USD Current price: 1.4191
View Live Chart for the GBP/USD
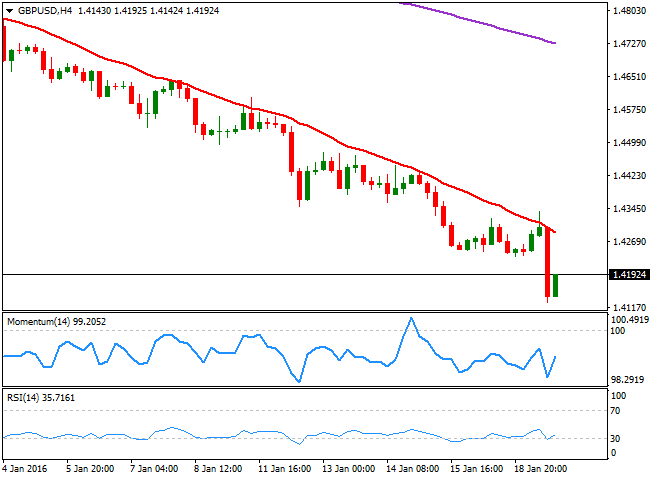
BOE's Governor, Mark Carney, gave a hand up to Pound's bears in a speech in London this Tuesday, by saying that "now, is not yet the time to raise interest rates," referring to plummeting oil prices and Chinese woes as the reason behind the decision. The GBP/USD pair sunk around 100 pips in the first hour after the speech, and maintained the negative tone, extending down to 1.4128 before finally bouncing some, a level last seen in March 2009. Earlier in the day, encouraging UK data failed to support the pair, as inflation in December matched expectations, whilst the producer price index continued to decline, albeit less than forecast. Currently correcting, the 4 hours chart shows that selling interest surged once again around a strongly bearish 20 SMA, now at 1.4290, while the technical indicators are bouncing from oversold levels, but still well below their mid-lines, suggesting the ongoing recovery is barely corrective. Former lows around 1.4250 are now an intermediate resistance in the case of further recoveries, while a break below the mentioned low support a decline down to the 1.4000 level for the upcoming sessions.
Support levels: 1.4165 1.4120 1.4080
Resistance levels: 1.4215 1.4250 1.4290
USD/JPY Current price: 117.48
View Live Chart for the USD/JPY
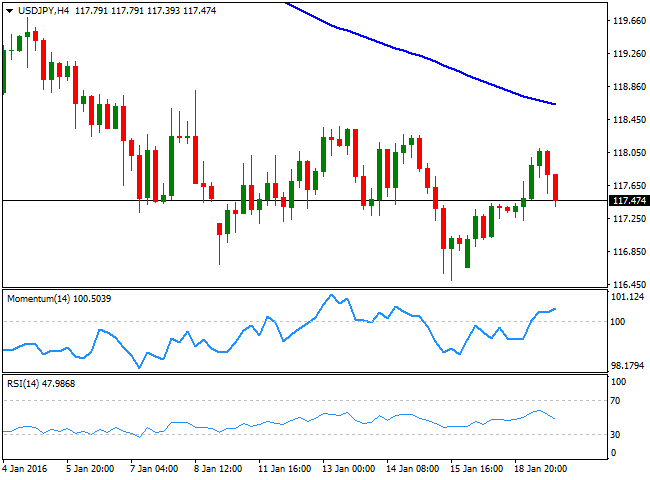
The Japanese yen started the day with a soft tone, weakening against the greenback amid a strong came back in Asian share markets. The USD/JPY pair extended its rally up to 118.10 during the London session, as European equities also recovered ground on improved market's mood and a bounce in oil prices, but the pair failed to sustain gains as risk aversion returned in the US session, as oil prices broke back below $30.00 a barrel, while US indexes retreated from their highs. Technically, the 1 hour chart shows that the price is now below its 100 and 200 SMAs that anyway maintain their bearish slopes, while the indicators have eased from overbought readings towards their mid-lines, where they currently stand. In the 4 hours chart, the price remains well below a strongly bearish 100 SMA, now acting as a dynamic resistance around 118.60, while the Momentum indicator heads higher above its 100 level, but the RSI already turned lower and stands around 48, anticipating some further declines on a downward acceleration below 117.30, the immediate support.
Support levels: 117.30 116.90 116.50
Resistance levels: 118.10 118.60 119.00
AUD/USD Current price: 0.6931
View Live Chart for the AUD/USD
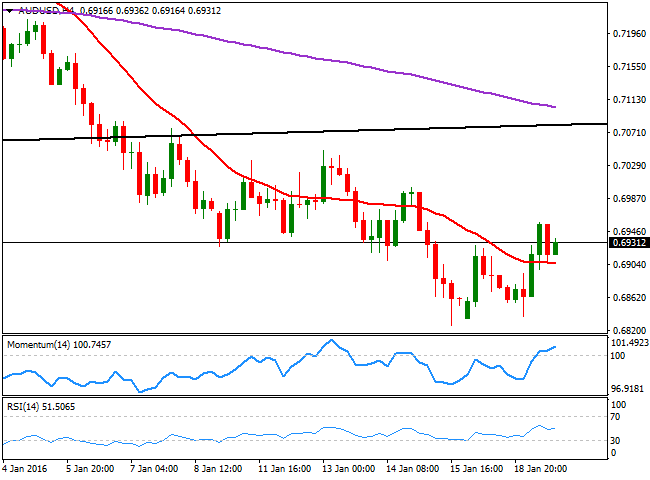
Commodity currencies were among the most benefited from the intraday recovery in oil, with the Aussie advancing up to 0.6959 against the greenback during the European morning. Speculative selling interest however, contained the rally, although the pair held to most of its daily gains, on broad dollar´s weakness by the end of the day. The long term bearish picture remains firm in place, although a short term upward corrective extension could not be dismissed at the time being, given that the 1 hour chart presents a bullish tone, as the technical indicators are barely retreating from overbought territory, whilst the price remains well above a bullish 20 SMA. In the 4 hours chart, the price is above a flat 20 SMA that provided a short term support in the American afternoon around 0.6905, while the Momentum indicator heads higher above the 100 level, and the RSI indicator hovers around its mid-line.
Support levels: 0.6905 0.6860 0.6825
Resistance levels: 0.6960 0.7000 0.7040
Information on these pages contains forward-looking statements that involve risks and uncertainties. Markets and instruments profiled on this page are for informational purposes only and should not in any way come across as a recommendation to buy or sell in these assets. You should do your own thorough research before making any investment decisions. FXStreet does not in any way guarantee that this information is free from mistakes, errors, or material misstatements. It also does not guarantee that this information is of a timely nature. Investing in Open Markets involves a great deal of risk, including the loss of all or a portion of your investment, as well as emotional distress. All risks, losses and costs associated with investing, including total loss of principal, are your responsibility. The views and opinions expressed in this article are those of the authors and do not necessarily reflect the official policy or position of FXStreet nor its advertisers. The author will not be held responsible for information that is found at the end of links posted on this page.
If not otherwise explicitly mentioned in the body of the article, at the time of writing, the author has no position in any stock mentioned in this article and no business relationship with any company mentioned. The author has not received compensation for writing this article, other than from FXStreet.
FXStreet and the author do not provide personalized recommendations. The author makes no representations as to the accuracy, completeness, or suitability of this information. FXStreet and the author will not be liable for any errors, omissions or any losses, injuries or damages arising from this information and its display or use. Errors and omissions excepted.
The author and FXStreet are not registered investment advisors and nothing in this article is intended to be investment advice.
Recommended Content
Editors’ Picks

Bitcoin breaks all-time high above $106,000, triggers nearly $120 million in liquidations
Bitcoin hit a record high above $106,000 on Monday, after recent developments on President-elect Donald Trump’s strategic Bitcoin reserve and demand from institutional traders.

EUR/USD holds ground above 1.0500 as looming Fed decision
EUR/USD starts the week by extending its gains, trading around 1.0520 during the Asian session on Monday. This upside could be attributed to the decline in the US Dollar amid tepid US Treasury yields ahead of the Federal Reserve’s interest rate decision set for Wednesday.
GBP/USD edges higher to 1.2630, looks to UK/US PMIs for some impetus
The GBP/USD pair ticks higher at the start of a busy week and for now, seems to have snapped a three-day losing streak to the 1.2600 neighborhood, or over a two-week low touched on Friday.

Gold price holds steady above one-week low on softer USD; upside seems limited
Gold price stages a modest bounce from a one-week trough touched earlier this Monday. Geopolitical tensions, softer US bond yields and USD benefit the safe-haven XAU/USD. Bets for a less dovish Fed warrant caution for bull ahead of the FOMC meeting this week.

Can markets keep conquering record highs?
Equity markets are charging to new record highs, with the S&P 500 up 28% year-to-date and the NASDAQ Composite crossing the key 20,000 mark, up 34% this year. The rally is underpinned by a potent mix of drivers.

Best Forex Brokers with Low Spreads
VERIFIED Low spreads are crucial for reducing trading costs. Explore top Forex brokers offering competitive spreads and high leverage. Compare options for EUR/USD, GBP/USD, USD/JPY, and Gold.
