EUR/USD Current price: 1.0911
View Live Chart for the EUR/USD
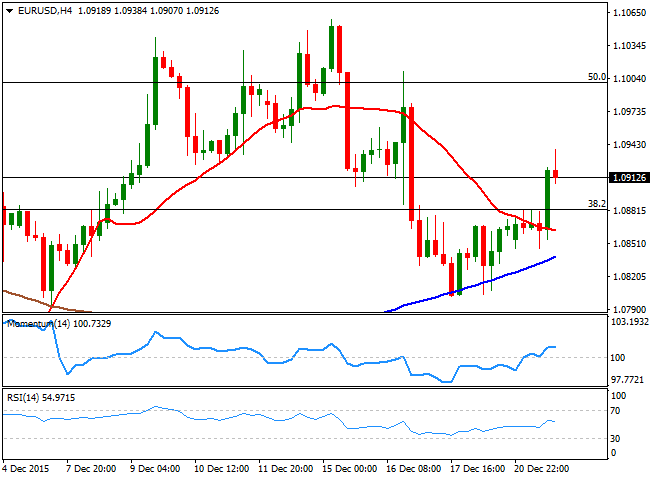
A quiet beginning of the week saw the EUR/USD pair advancing up to 1.0938, its highest ever since the FED's 25bp rate hike, last Wednesday. If something, a strong bounce in gold prices was behind the rally, exacerbated by thin holiday volumes. The macroeconomic calendar offered no trading clues, as during the European morning, Germany PPI for November resulted as expected. Investors will be now looking for the outcome of the final revision of the US Q3 GDP reading to be released this Tuesday, expected to remain unchanged from its previous revision at 2.1%.
The pair has recovered some of its former shine, as the intraday technical picture is mild bullish ahead of the Asian opening, according to the 4 hours chart, where the price has recovered above its moving averages, while the technical indicators are back above their mid-lines, but lacking upward momentum. Also, the pair has recovered above the 1.0880 level, the 38.2% retracement of its latest monthly decline, now the immediate support. Nevertheless, the pair is expected to remain confined to a limited intraday range during the upcoming days, with some short lived spikes in between, with no apparent catalyst behind them.
Support levels: 1.0880 1.0840 1.0790
Resistance levels: 1.0915 1.0950 1.1000
EUR/JPY Current price: 132.19
View Live Chart for the EUR/JPY
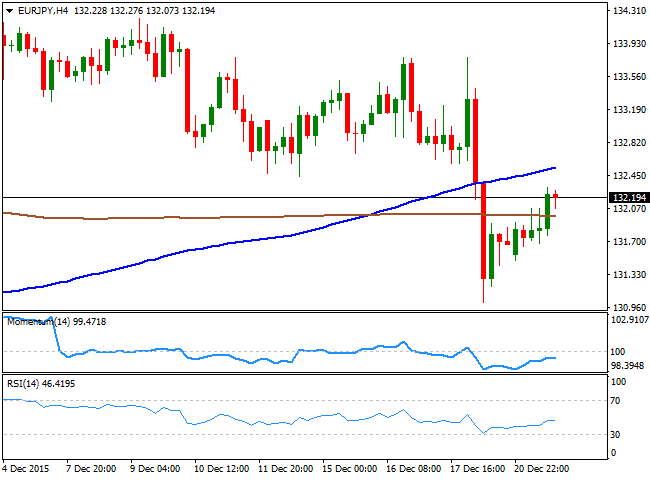
The EUR/JPY closed the day with some gains above the 132.00 level, helped by a rising intraday demand for the common currency. The pair however, is far from erasing Friday's losses triggered by the Bank of Japan's decision of change its stimulus program. The daily advance has been enough to turn the pair bullish in the short term, as in the 1 hour chart, the price has been steadily printing higher highs and higher lows, whilst the technical indicators have recovered above their mid-lines, with the RSI indicator heading higher above the 60 level. In the 4 hours chart, however, the technical indicators have stalled their recoveries below their mid-lines, suggesting the recent recovery is not yet enough to confirm a bullish continuation during the upcoming days.
Support levels: 131.95 131.50 131.00
Resistance levels: 132.40 132.80 133.30
GBP/USD Current price: 1.4885
View Live Chart for the GPB/USD
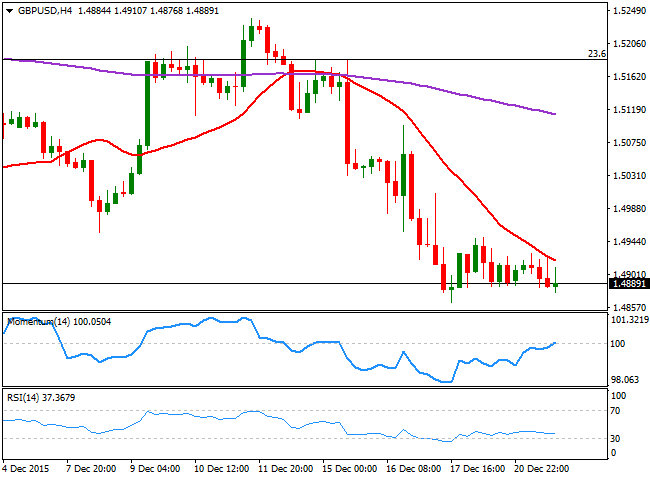
The GBPUSD pair has made little progress this Monday, holding near the 8-month low set last week at 1.4863, and closing the day a handful of pips below the 1.4900 figure, with the Pound being weighed by the remarks from BOE´s Martin Weale, highlighting that “the factors pushing down inflation have become a bit more prolonged,” which means that a rate hike is for now, out of sight. Technically speaking the 4 hours chart shows that the price has been capped by a bearish 20 SMA in an early attempt to advance, while the Momentum indicator diverges from price action, having recovered up to its mid-line. The RSI indicator however, maintains a bearish slope near 36, supporting further declines particularly on a break below 1.4860, the mentioned low and the immediate support. Such break should open doors for a continued decline towards the 1.4750 region, the next strong mid-term static support area.
Support levels: 1.4860 1.4815 1.4770
Resistance levels: 1.4920 1.4950 1.4995
USD/JPY Current price: 121.16
View Live Chart for the USD/JPY
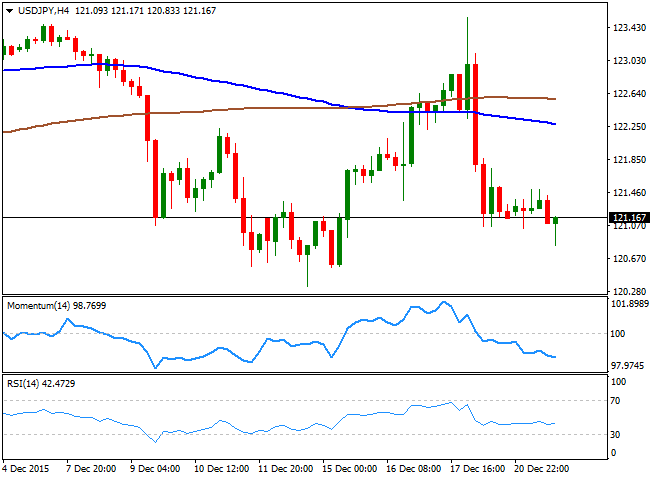
The Japanese yen has strengthened against its American rival, with the USD/JPY extending its decline down to 120.83 in the American afternoon on the back of stocks decline. Ending the day barely in the red, the pair remains stuck around its 100 DMA, while the overall bearish tone triggered by the BOJ prevails, as the daily indicators maintain their bearish slopes below their mid-lines. In the shorter term, he 1 hour chart favors a continued decline, given that the price is below its moving averages, whilst the technical indicators head slightly lower below their mid-lines, with no actual momentum. In the 4 hours chart, however, the bearish trend is clearer, as the price has extended further below its moving averages, whilst the technical indicators maintain their bearish slopes within negative territory. Renewed selling interest below 120.70 can see the pair extending its decline down to 120.35, a strong static support level where buying interest is expected to surge.
Support levels: 121.05 120.70 120.35
Resistance levels: 121.70 122.20 122.66
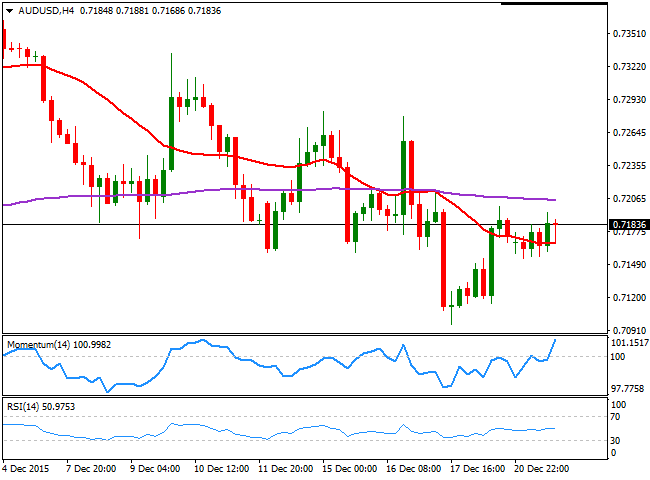
AUD/USD Current price: 0.7183
View Live Chart for the AUD/USD
The AUD/USD pair has managed to advance some in thin trading, having however, been unable to regain the 0.7200 level. The Aussie got some support by a recovery in base metals' prices, but the poor performance of the antipodean currency suggests the latest bullish tone may be close to its end. From a technical point of view, the big picture is bearish, as in the 1 hour chart, the technical indicators head lower below their mid-lines as the price holds below its 20 SMA that lacks directional strength. In the shorter term, the 1 hour chart shows that the price has managed to advance above its 20 SMA, while the technical indicators hold above their mid-lines, showing no actual directional strength. In the 4 hours chart, the price is above a bearish 20 SMA and below the 200 EMA, while the Momentum indicator heads sharply higher above its 100 level, rather reflecting the intraday advance than suggesting further gains. At this point, the pair needs to advance beyond the 0.7240 level to confirm a more sustainable rally during the upcoming sessions.
Support levels: 0.7150 0.7120 0.7070
Resistance levels: 0.7200 0.7240 0.7280
Information on these pages contains forward-looking statements that involve risks and uncertainties. Markets and instruments profiled on this page are for informational purposes only and should not in any way come across as a recommendation to buy or sell in these assets. You should do your own thorough research before making any investment decisions. FXStreet does not in any way guarantee that this information is free from mistakes, errors, or material misstatements. It also does not guarantee that this information is of a timely nature. Investing in Open Markets involves a great deal of risk, including the loss of all or a portion of your investment, as well as emotional distress. All risks, losses and costs associated with investing, including total loss of principal, are your responsibility. The views and opinions expressed in this article are those of the authors and do not necessarily reflect the official policy or position of FXStreet nor its advertisers. The author will not be held responsible for information that is found at the end of links posted on this page.
If not otherwise explicitly mentioned in the body of the article, at the time of writing, the author has no position in any stock mentioned in this article and no business relationship with any company mentioned. The author has not received compensation for writing this article, other than from FXStreet.
FXStreet and the author do not provide personalized recommendations. The author makes no representations as to the accuracy, completeness, or suitability of this information. FXStreet and the author will not be liable for any errors, omissions or any losses, injuries or damages arising from this information and its display or use. Errors and omissions excepted.
The author and FXStreet are not registered investment advisors and nothing in this article is intended to be investment advice.
Recommended Content
Editors’ Picks

EUR/USD eases to daily lows near 1.0260
Better-than-expected results from the US docket on Friday lend wings to the US Dollar and spark a corrective decline in EUR/USD to the area of daily lows near 1.0260.

GBP/USD remains under pressure on strong Dollar, data
GBP/USD remains on track to close another week of losses on Friday, hovering around the 1.2190 zone against the backdrop of the bullish bias in the Greenback and poor results from the UK calendar.

Gold recedes from tops, retests $2,700
The daily improvement in the Greenback motivates Gold prices to give away part of the weekly strong advance and slip back to the vicinity of the $2,700 region per troy ounce at the end of the week.

Five keys to trading Trump 2.0 with Gold, Stocks and the US Dollar Premium
Donald Trump returns to the White House, which impacts the trading environment. An immediate impact on market reaction functions, tariff talk and regulation will be seen. Tax cuts and the fate of the Federal Reserve will be in the background.

Hedara bulls aim for all-time highs
Hedara’s price extends its gains, trading at $0.384 on Friday after rallying more than 38% this week. Hedara announces partnership with Vaultik and World Gemological Institute to tokenize $3 billion in diamonds and gemstones

Trusted Broker Reviews for Smarter Trading
VERIFIED Discover in-depth reviews of reliable brokers. Compare features like spreads, leverage, and platforms. Find the perfect fit for your trading style, from CFDs to Forex pairs like EUR/USD and Gold.
