EUR/USD Current price: 1.0929
View Live Chart for the EUR/USD
The American dollar recovered its shine, edging higher against all of its major rivals, but the CAD that benefited from a continued recovery in oil prices. For a change, the greenback's steep appreciation took place in the US session, following the release of improved, but soft, local inflation figures. The CPI rose by 0.5% in the last 12 months to November, better than the previous 0.2% or the expected 0.4% advance, but remained unchanged in its monthly comparison. Also, the Empire State manufacturing survey showed that business activity declined for a fifth consecutive month, although less than expected, printing -4.59 in December. Things were slightly better in the EU, as the ZEW survey showed that the economic sentiment in the region improved to 33.9 from a previous 28.3, although missing market's expectations of 34.4. German figures however, resulted extremely positive.
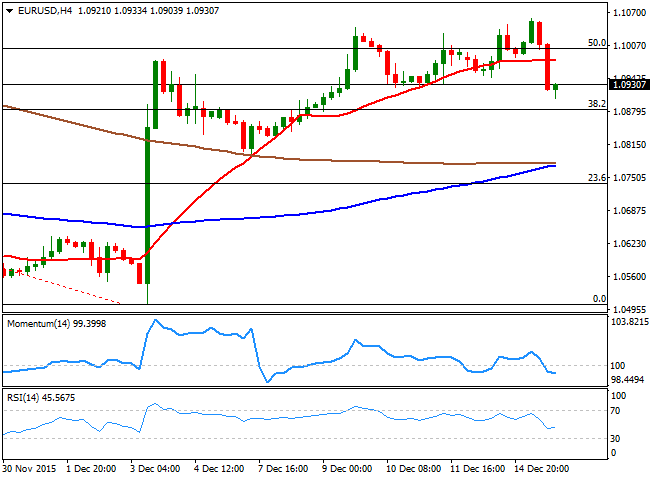
The EUR/USD pair rose up to 1.1059 ahead of the European opening, from where the dollar began to recover, gaining momentum after the release of US data. The pair fell down to 1.0903 before bouncing some, but maintains a short term negative tone, as in the 1 hour chart, the price has extended its decline below all of its moving averages, whilst the technical indicators have barely lost their bearish strength, but hold near oversold levels. In the 4 hours chart, the technical picture is also bearish as the pair broke with a long volume candle below its 20 SMA, while the technical indicators are now in bearish territory. Nevertheless, the market will move on sentiment this Wednesday, and following whatever the US Central Bank decides to do.
Support levels: 1.0905 1.0870 1.0830
Resistance levels: 1.0950 1.0990 1.1045
EUR/JPY Current price: 132.97
View Live Chart for the EUR/JPY
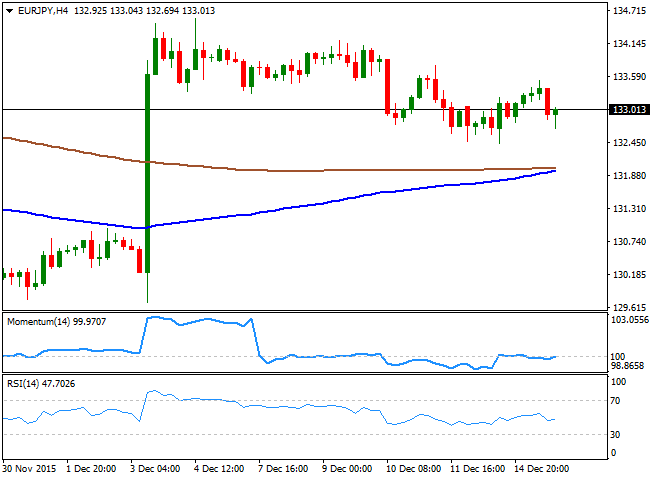
The EUR/JPY ends the day around the 133.00 level for one more day, having however, managed to post a higher high and a higher low daily basis, the first sign of a possible recovery in nearly two weeks. The pair however, continues trading below a bearish 100 DMA now around 134.00 and a bullish breakout point. Shorter term the 1 hour chart shows that the technical indicators head lower below their mid-lines, whilst the price is also developing below a bearish 100 SMA. In the 4 hours chart, the price is holding above its 100 and 200 SMAs, both converging around 132.00, while the technical indicators lack directional strength, stuck around their mid-lines.
Support levels: 132.55 132.10 131.70
Resistance levels: 133.40 133.75 134.20
GBP/USD Current price: 1.5057
View Live Chart for the GPB/USD
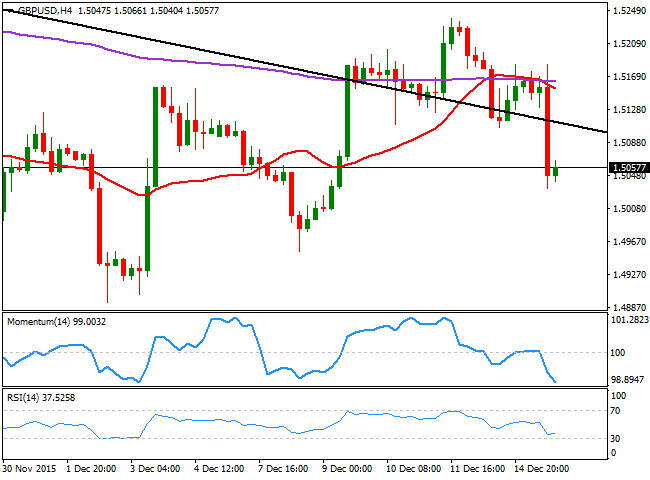
The British Pound held around the 1.5150 level during the first half of the day, finding some support in the latest UK inflation data, as the headline reading, rose by 0.1% y/y in November, matching market expectations. The core measure also came out as expected, posting a 1.2% y/y gain, the highest since July this year, although producer prices fell in the year to November 2015, drove down by oil's continued decline. The GBP/USD pair finally gave up in the American afternoon, falling down to 1.5032 before bouncing some. The technical picture has turned bearish, as the pair erased all of its last week gains. In the 1 hour chart, the 20 SMA has turned lower well above the current level, while the technical indicators consolidate near oversold levels, indicating that bears are still in the drivers' seat. In the 4 hours chart, the pair was unable to advance beyond its 200 EMA for a second day in-a-row before finally easing, while the Momentum indicator heads sharply lower below its mid-line and the RSI indicator holds near oversold readings, supporting the shorter term view.
Support levels: 1.5025 1.4980 1.4940
Resistance levels: 1.5050 1.5090 1.5135
USD/JPY Current price: 121.69
View Live Chart for the USD/JPY
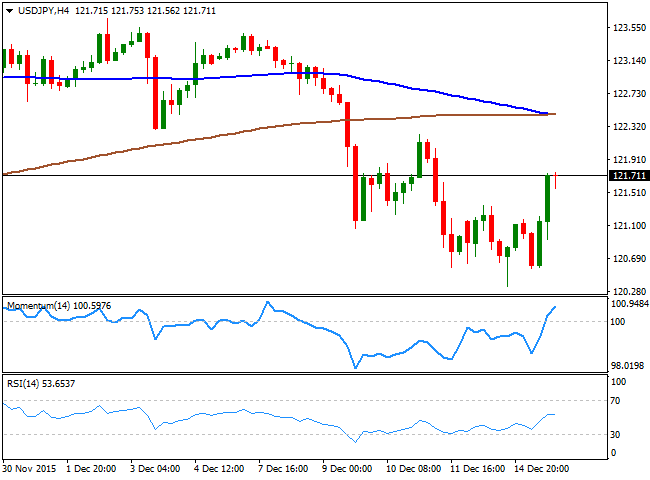
The USD/JPY pair rallied this Tuesday on broad dollar's strength, advancing up to the 121.70 region, where it ended the day. Having erased all of its Friday's losses, the pair advanced in anticipation of the US Federal Reserve announcement this Friday, as the Central Bank is largely expected to announce its first rake hike in over nine years. The pair was also helped by a recovery in stocks, as oil bounced and brought some relief to financial markets. The technical picture is not yet confirming additional gains as in the daily chart, the pair has managed to recover above its 100 DMA, but the technical indicators remain below their mid-lines. In the same chart, the 200 DMA acts now as an immediate resistance in the 121.90 region. Intraday, and according to the 1 hour chart, the upward potential is still strong, as the pair advanced well above its 100 SMA, while the technical indicators continue heading higher, despite being in overbought territory. In the 4 hours chart, the Momentum indicator heads strongly higher above its 100 level, while the RSI indicator hovers around 54, favoring some further gains for the Asian session.
Support levels: 121.00 120.60 120.30
Resistance levels: 121.35 121.70 122.20
AUD/USD Current price: 0.7248
View Live Chart for the AUD/USD
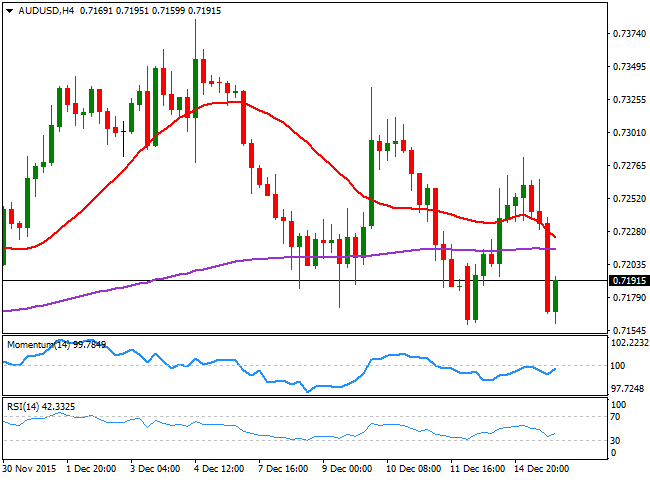
The Australian dollar edged lower this Tuesday, breaking below the 0.7200 level against the greenback after a positive start of the day, following the release of the latest RBA meeting minutes. The Reserve Bank of Australia was optimistic on how the economy has evolved, but Governor Glen Stevens also said that there's room to ease the economic policy further if needed. The AUD/USD pair fell down to 0.7159 before recovering some ground before the close, but heads into the Asian session with a short term bearish tone, as in the 1 hour chart, the 20 SMA has turned sharply lower above the current level, while the technical indicators are resuming their declines after correcting oversold readings. In the 4 hours chart, the pair is now below a bearish 20 SMA and a horizontal 200 EMA, while the technical indicators have bounced from near oversold levels, but remain below their mid-lines. Buyers have been surging in the 0.7160/70 region, and a clear break below it should keep the risk towards the downside.
Support levels: 0.7160 0.7125 0.7090
Resistance levels: 0.7200 0.7240 0.7285
-------
What will 2016 bring to the Forex traders? Attend our event, Forex Forecast 2016 - The Panel with Ashraf Laidi, Valeria Bednarik, Boris Schlossberg, Adam Button, Ivan Delgado and Dale Pinkert. Register for the live event on Dec. 18th and get the recording too.
-------
Information on these pages contains forward-looking statements that involve risks and uncertainties. Markets and instruments profiled on this page are for informational purposes only and should not in any way come across as a recommendation to buy or sell in these assets. You should do your own thorough research before making any investment decisions. FXStreet does not in any way guarantee that this information is free from mistakes, errors, or material misstatements. It also does not guarantee that this information is of a timely nature. Investing in Open Markets involves a great deal of risk, including the loss of all or a portion of your investment, as well as emotional distress. All risks, losses and costs associated with investing, including total loss of principal, are your responsibility. The views and opinions expressed in this article are those of the authors and do not necessarily reflect the official policy or position of FXStreet nor its advertisers. The author will not be held responsible for information that is found at the end of links posted on this page.
If not otherwise explicitly mentioned in the body of the article, at the time of writing, the author has no position in any stock mentioned in this article and no business relationship with any company mentioned. The author has not received compensation for writing this article, other than from FXStreet.
FXStreet and the author do not provide personalized recommendations. The author makes no representations as to the accuracy, completeness, or suitability of this information. FXStreet and the author will not be liable for any errors, omissions or any losses, injuries or damages arising from this information and its display or use. Errors and omissions excepted.
The author and FXStreet are not registered investment advisors and nothing in this article is intended to be investment advice.
Recommended Content
Editors’ Picks

EUR/USD clings to daily gains near 1.0300 after US PMI data
EUR/USD trades in positive territory at around 1.0300 on Friday. The pair breathes a sigh of relief as the US Dollar rally stalls, even as markets stay cautious amid geopolitical risks and Trump's tariff plans. US ISM PMI improved to 49.3 in December, beating expectations.

GBP/USD holds around 1.2400 as the mood improves
GBP/USD preserves its recovery momentum and trades around 1.2400 in the American session on Friday. A broad pullback in the US Dollar allows the pair to find some respite after losing over 1% on Thursday. A better mood limits US Dollar gains.

Gold retreats below $2,650 in quiet end to the week
Gold shed some ground on Friday after rising more than 1% on Thursday. The benchmark 10-year US Treasury bond yield trimmed pre-opening losses and stands at around 4.57%, undermining demand for the bright metal. Market players await next week's first-tier data.

Stellar bulls aim for double-digit rally ahead
Stellar extends its gains, trading above $0.45 on Friday after rallying more than 32% this week. On-chain data indicates further rally as XLM’s Open Interest and Total Value Locked rise. Additionally, the technical outlook suggests a rally continuation projection of further 40% gains.

Week ahead – US NFP to test the markets, Eurozone CPI data also in focus
King Dollar flexes its muscles ahead of Friday’s NFP. Eurozone flash CPI numbers awaited as euro bleeds. Canada’s jobs data to impact bets of a January BoC cut. Australia’s CPI and Japan’s wages also on tap.

Best Forex Brokers with Low Spreads
VERIFIED Low spreads are crucial for reducing trading costs. Explore top Forex brokers offering competitive spreads and high leverage. Compare options for EUR/USD, GBP/USD, USD/JPY, and Gold.
