EUR/USD Current price: 1.1027
View Live Chart for the EUR/USD
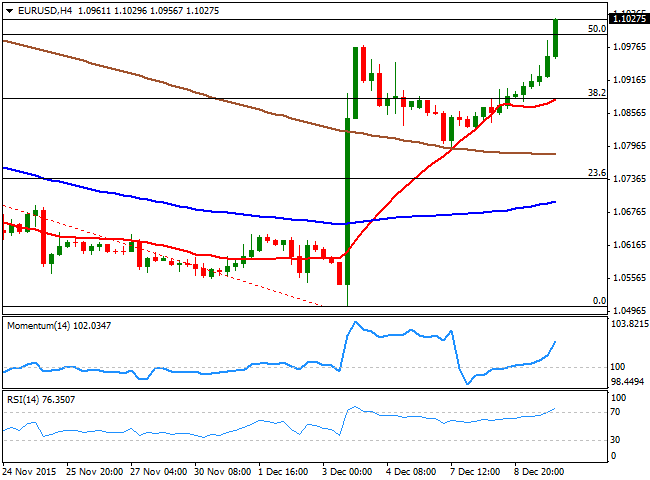
A dollar sell-off helped the EUR/USD pair advance through the 1.1000 level for the first time in over a month. There was no catalyst behind the move, although US stocks collapse during the American afternoon, fueled the decline of the greenback. The most relevant piece of data released in the EU was the German Trade balance for October, which resulted in a surplus of 20.8 billion Euros, but hardly affected the market at the time.
The pair advanced up to 1.1029 and held above the 1.1000 figure by the end of the day, with the technical bias being clearly bullish, amid the price extending above a now bullish 20 SMA and above the 50% retracement of the October/November decline around 1.1000. Furthermore, and in the 4 hours chart, the technical indicators aim sharply higher in overbought territory, in line with further advances, should the price extend its advance beyond 1.1040, now the immediate resistance.
Support levels: 1.0990 1.0945 1.0910
Resistance levels: 1.1045 1.1085 1.1120
EUR/JPY Current price: 133.63
View Live Chart for the EUR/JPY
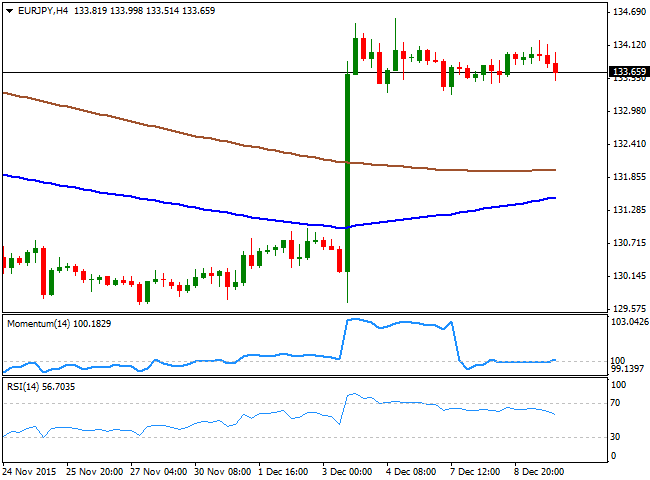
The EUR/JPY pair fell on yen's strength, although remains within its recent range. A technical breakout of the USD/JPY which triggered stops was behind the EUR/USD decline towards 133.51 in the American afternoon. Short term, the pair is favored towards the downside, as in the 1 hour chart, the price is now below its 100 SMA, while the technical indicators aim slightly higher, but below their mid-lines, indicating no certain strength at the time being. In the 4 hours chart, the pair is near the base of its latest range, a major static support at 133.30, while the RSI indicator turned south around 56 and the Momentum indicator stands flat around its 100 level, all of which fails to suggest a clear directional bias, but maintains the risk towards the downside.
Support levels: 133.30 132.80 132.40
Resistance levels: 133.75 134.20 134.60
GBP/USD Current price: 1.5163
View Live Chart for the GPB/USD
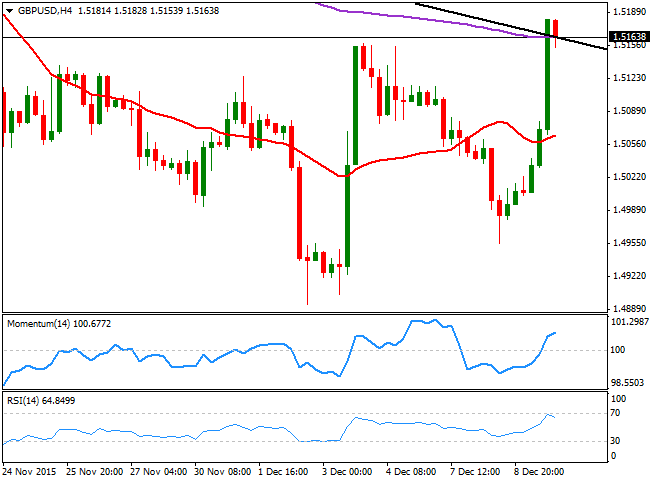
The British Pound was among the most benefited by dollar's weakness, as the GBP/USD pair added over 150 pips this Wednesday. The pair fell below the 1.5000 level, as poor UK data spurred speculation that the BOE will have to delay a rate hike beyond the current estimate of the first half of 2016. Anyway, the Bank of England will have its monthly economic meeting, which may shed some light over the upcoming decisions. As for the technical picture, the pair has flirted with the 1.5200 level before pulling back some, but holds to its gains, and the short term picture is bullish, as in the 1 hour chart, the technical indicators aim higher in overbought territory, whilst the price has extended far above a strongly bullish 20 SMA. In the 4 hours chart, the price is currently developing above the 200 EMA and a daily descendant trend line coming from this November high at 1.5496, both converging at 1.5160, now the immediate support. In this last time frame, the technical indicators are partially losing their upward strength in overbought territory, still favoring additional advances in the pair.
Support levels: 1.5050 1.5010 1.4980
Resistance levels: 1.5100 1.5160 1.5200
USD/JPY Current price: 122.42
View Live Chart for the USD/JPY
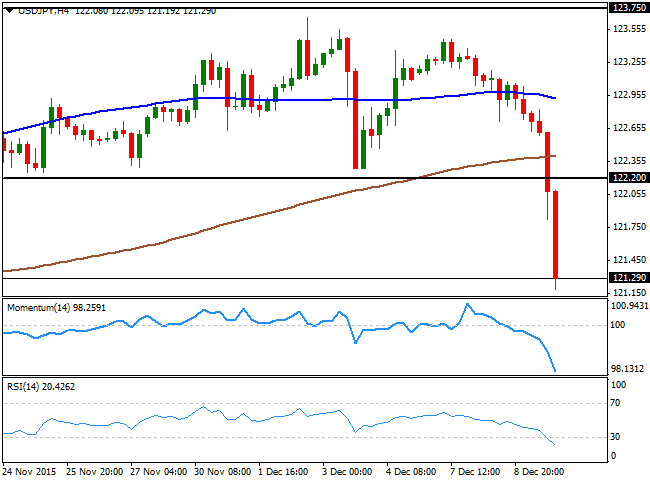
The USD/JPY pair plummeted to its lowest since November 4th, down on the day over 170 pips after triggering a technical breakout at the beginning of the US session. The Japanese yen advanced ever since the day started, helped by better-than-expected Chinese inflation data, as in November, CPI rose to 1.5% compared to a year before, from a previous 1.3%. But was the break below the 122.20 level which fueled the decline of the pair, also supported by Wall Street's decline. Short term, the downside potential is now limited as the technical indicators are turning slightly higher in extreme oversold levels, rather suggesting some consolidation that supporting a bullish move. In the same chart however, the 100 SMA is crossing below the 200 SMA in the 123.00 region, signaling bears are now in control. In the 4 hours chart, the price fell far below its 100 and 200 SMAs, while the technical indicators retain sharp bearish slopes, despite being in oversold territory in line with further declines particularly on a break below the 120.00 figure.
Support levels: 121.00 120.70 120.30
Resistance levels: 121.40 121.80 122.20
AUD/USD Current price: 0.7202
View Live Chart for the AUD/USD
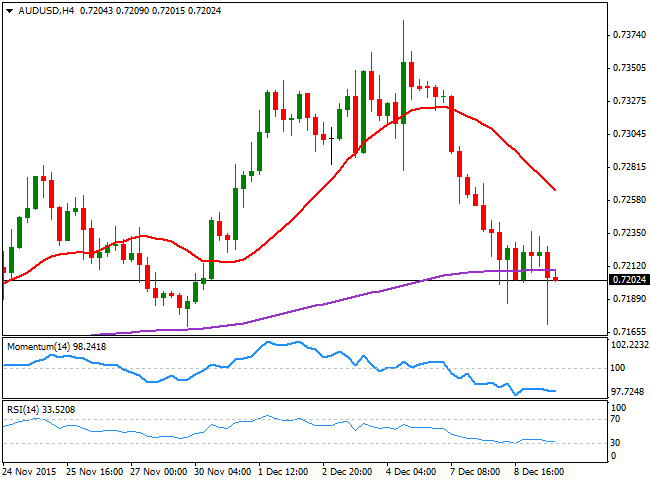
The Australian dollar extended its decline against its American rival down to 0.7188 this Wednesday, weak amid falling commodities and despite the dollar's sell-off. Australia will release its November employment figures during the upcoming Asian session, and the country is expected to have lost 10K job positions during the month, balancing the outstanding gain from October, when the economy added 58.6K new jobs. The unemployment rate is expected to tick higher, up to 6.0% from a previous 5.9%. News have to be strongly positive to revert the latest AUD decline, and the key level to watch is now 0.7240 as only same gains beyond it will favor further advances. From a technical point of view, the 1 hour chart presents a neutral stance, with the technical indicators flat around their mid-lines, while in the 4 hours chart the price is now below a bullish 20 SMA, while the technical indicators are aiming to bounce from their mid-lines, lacking momentum at the time being, but help keeping the downside limited.
Support levels: 0.7170 0.7140 0.7110
Resistance levels: 0.7240 0.7290 0.7335
Information on these pages contains forward-looking statements that involve risks and uncertainties. Markets and instruments profiled on this page are for informational purposes only and should not in any way come across as a recommendation to buy or sell in these assets. You should do your own thorough research before making any investment decisions. FXStreet does not in any way guarantee that this information is free from mistakes, errors, or material misstatements. It also does not guarantee that this information is of a timely nature. Investing in Open Markets involves a great deal of risk, including the loss of all or a portion of your investment, as well as emotional distress. All risks, losses and costs associated with investing, including total loss of principal, are your responsibility. The views and opinions expressed in this article are those of the authors and do not necessarily reflect the official policy or position of FXStreet nor its advertisers. The author will not be held responsible for information that is found at the end of links posted on this page.
If not otherwise explicitly mentioned in the body of the article, at the time of writing, the author has no position in any stock mentioned in this article and no business relationship with any company mentioned. The author has not received compensation for writing this article, other than from FXStreet.
FXStreet and the author do not provide personalized recommendations. The author makes no representations as to the accuracy, completeness, or suitability of this information. FXStreet and the author will not be liable for any errors, omissions or any losses, injuries or damages arising from this information and its display or use. Errors and omissions excepted.
The author and FXStreet are not registered investment advisors and nothing in this article is intended to be investment advice.
Recommended Content
Editors’ Picks

AUD/USD faces potential extra gains near term
AUD/USD faced renewed upward pressure following the US Dollar’s sell-off, successfully reclaiming the key 0.6300 mark and beyond, supported by persistent optimism in the risk complex.

EUR/USD now looks to challenge 1.0500
EUR/USD gained ground for the third consecutive day on Thursday, trading within close reach of the 1.0450 level, or three-week highs, driven by a strong selling bias in the Greenback.

Gold comfortable around $2,910
Gold prices now extend the recent breakout of the key $2,900 mark per ounce troy on the back of persistent weakness in the US Dollar and diminishing US yields across the curve.

Three reasons why PancakeSwap CAKE is rallying 96% in seven days
PancakeSwap’s native token CAKE extended gains by 8% on Thursday, inching closer to the $3 level. The DEX token hit several key milestones in the last 30 days, according to an official update shared on X.

Tariffs likely to impart a modest stagflationary hit to the economy this year
The economic policies of the Trump administration are starting to take shape. President Trump has already announced the imposition of tariffs on some of America's trading partners, and we assume there will be more levies, which will be matched by foreign retaliation, in the coming quarters.

The Best Brokers of the Year
SPONSORED Explore top-quality choices worldwide and locally. Compare key features like spreads, leverage, and platforms. Find the right broker for your needs, whether trading CFDs, Forex pairs like EUR/USD, or commodities like Gold.
