EUR/USD Current price: 1.0901
View Live Chart for the EUR/USD
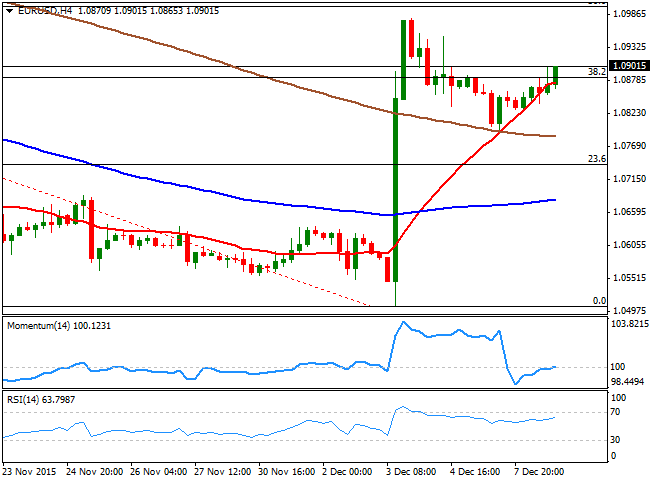
The common currency ends the day higher against its American rival, albeit having held within quite a limited intraday range, and below the 1.0900 figure. The macroeconomic calendar was light amid a Christian holiday, observed by many European countries. At the beginning of the day, the EU released a revision of its Q3 GDP readings, which matched previous estimates and failed to trigger some market's action. In the US, the number of job openings was little changed at 5.4 million on the last business day of October, according to the Bureau of Labor Statistics, while consumer confidence in the country surged in December, as the IBD/TIPP Economic Optimism Index improved 1.7 points, in December, posting a reading of 47.2 vs. 45.5 in November.
The EUR/USD pair traded in the green for most of the day, with the EUR still on demand after the latest ECB decision. The short term picture is bullish, despite the lack of momentum, as in the 1 hour chart, the price is above a bullish 20 SMA, while the technical indicators aim higher above their mid-lines. In the 4 hours chart, the technical readings also favor more gains, as the indicators aim higher around their mid-lines whilst the price is extending above a strongly bullish 20 SMA. A steadier advance beyond the 1.0900 level, should anticipate further gains towards the 1.1000 figure this Wednesday, where some selling interest is expected to contain further rallies.
Support levels: 1.0880 1.0835 1.0805
Resistance levels: 1.0910 1.0945 1.1000
EUR/JPY Current price: 133.91
View Live Chart for the EUR/JPY
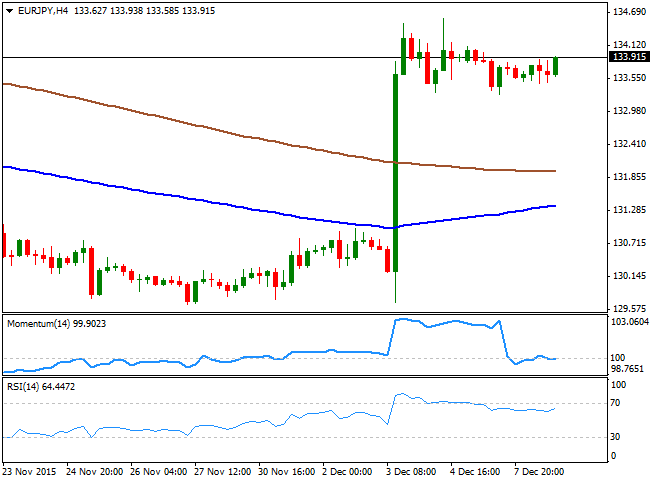
The EUR/JPY pair continues trading range bound, ending the day slightly higher amid EUR's strength, although with the pair still unable to firm up above the 134.00 figure. The intraday technical readings have finally erased the distortions of last week, and the 1 hour chart shows that the price continues consolidating well above its 100 and 200 SMAs, with the shortest accelerating its advance below the current price. In the same chart the technical indicators post tepid advances in positive territory, but fail to confirm an upward continuation at the time being. In the 4 hours chart, the RSI indicator heads higher around 64, but the Momentum indicator lacks directional strength around its mid-line, suggesting some further consolidation ahead. An advance above 134.20 should favor some further gains, pointing then to a test of the 135.00 region.
Support levels: 133.65 133.30 132.80
Resistance levels: 134.20 134.60 135.00
GBP/USD Current price: 1.5009
View Live Chart for the GPB/USD
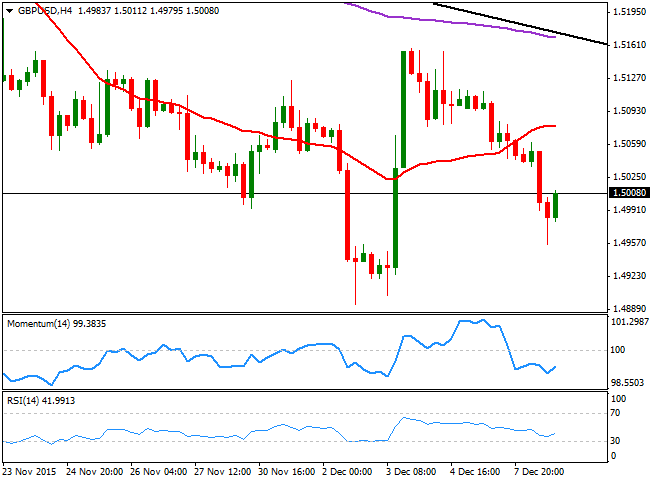
The GBP/USD pair edged lower for a third day in-a-row, having fell down to 1.4955 before recovering the 1.5000 level before the US close. The British Pound was weighed by falling oil prices, and worse-than-expected UK factory output, down in October by 0.1%. Industrial Production grew slightly above expected, not enough, however, to help the currency advance. The pair enters the Asian session correcting its short term oversold readings, but maintaining a bearish tone, given that in the 1 hour chart, the technical indicators have bounced from extreme readings, but are now losing upward strength below their mid-lines, whilst the price remains well below a bearish 20 SMA. In the 4 hours chart, the price is below the 20 SMA, while the technical indicators are aiming higher from near oversold territory, but remain well into negative territory and unable to confirm a clear directional strength.
Support levels: 1.4950 1.4920 1.4880
Resistance levels: 1.5010 1.5050 1.5090
USD/JPY Current price: 122.86
View Live Chart for the USD/JPY
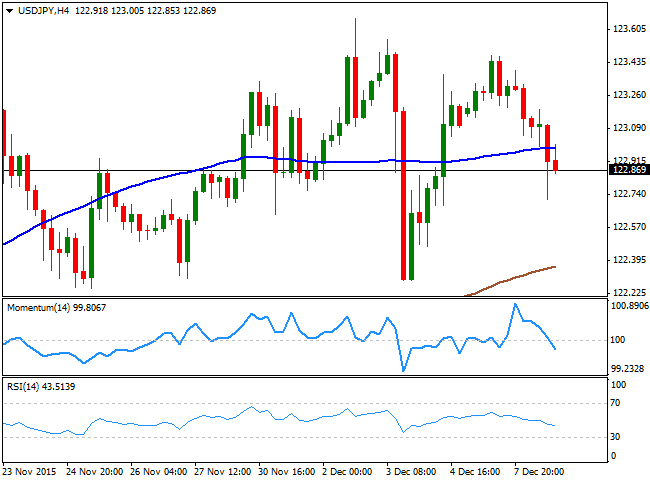
The Japanese yen ended the day higher against its American rival, helped by the release of a stronger-than-expected second estimate of Japanese GDP in Q3. Real GDP growth in Japan was revised upwards to an annualized expansion of 1.0% from an initially reported contraction of -0.8%. The USD/JPY pair fell down to 122.71 in the American afternoon, and remains unable to recoup the 123.00 level ahead of the Asian session. Technically, and according to the 1 hour chart, the downside is favored, as the price has extended below the 100 and 200 SMAs, with the latest acting as an immediate resistance around 123.00, while the technical indicators head south below their mid-lines, supporting further declines. In the 4 hours chart, the Momentum indicator is crossing its mid-line towards the downside, while the RSI indicator heads lower around 44 supporting a bearish continuation, but with no momentum at the time being.
Support levels: 122.60 122.20 121.80
Resistance levels: 123.00 123.40 123.75
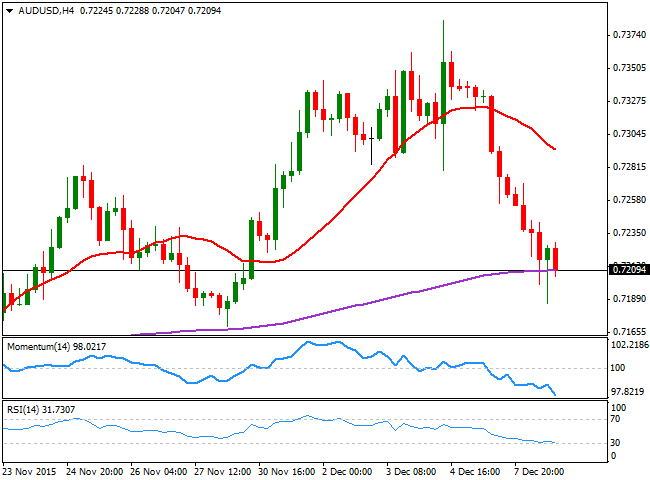
AUD/USD Current price: 0.7208
View Live Chart for the AUD/USD
The AUD/USD pair extended its decline down to 0.7185 as commodities slumped, recovering right above the 0.7200 level before the US close. Maintaining a strong negative tone, the Aussie will have to face now some confidence and housing data, expected generally lower and therefore in line with further declines. Nevertheless, the key event will be next Thursday, when Australia will release its November employment figures. In the meantime, the 1 hour chart shows that the pair has met selling interest on an approach to a strongly bearish 20 SMA, while the technical indicators are turning back lower after correcting oversold readings, maintaining the risk towards the downside. In the 4 hours chart, the bearish momentum is even clearer, given that the technical indicators head sharply lower below their mid-lines, whilst the 20 SMA turns lower far above the current price.
Support levels: 0.7170 0.7140 0.7110
Resistance levels: 0.7240 0.7290 0.7335
Information on these pages contains forward-looking statements that involve risks and uncertainties. Markets and instruments profiled on this page are for informational purposes only and should not in any way come across as a recommendation to buy or sell in these assets. You should do your own thorough research before making any investment decisions. FXStreet does not in any way guarantee that this information is free from mistakes, errors, or material misstatements. It also does not guarantee that this information is of a timely nature. Investing in Open Markets involves a great deal of risk, including the loss of all or a portion of your investment, as well as emotional distress. All risks, losses and costs associated with investing, including total loss of principal, are your responsibility. The views and opinions expressed in this article are those of the authors and do not necessarily reflect the official policy or position of FXStreet nor its advertisers. The author will not be held responsible for information that is found at the end of links posted on this page.
If not otherwise explicitly mentioned in the body of the article, at the time of writing, the author has no position in any stock mentioned in this article and no business relationship with any company mentioned. The author has not received compensation for writing this article, other than from FXStreet.
FXStreet and the author do not provide personalized recommendations. The author makes no representations as to the accuracy, completeness, or suitability of this information. FXStreet and the author will not be liable for any errors, omissions or any losses, injuries or damages arising from this information and its display or use. Errors and omissions excepted.
The author and FXStreet are not registered investment advisors and nothing in this article is intended to be investment advice.
Recommended Content
Editors’ Picks

EUR/USD clings to daily gains near 1.0300 after US PMI data
EUR/USD trades in positive territory at around 1.0300 on Friday. The pair breathes a sigh of relief as the US Dollar rally stalls, even as markets stay cautious amid geopolitical risks and Trump's tariff plans. US ISM PMI improved to 49.3 in December, beating expectations.

GBP/USD holds around 1.2400 as the mood improves
GBP/USD preserves its recovery momentum and trades around 1.2400 in the American session on Friday. A broad pullback in the US Dollar allows the pair to find some respite after losing over 1% on Thursday. A better mood limits US Dollar gains.

Gold retreats below $2,650 in quiet end to the week
Gold shed some ground on Friday after rising more than 1% on Thursday. The benchmark 10-year US Treasury bond yield trimmed pre-opening losses and stands at around 4.57%, undermining demand for the bright metal. Market players await next week's first-tier data.

Stellar bulls aim for double-digit rally ahead
Stellar extends its gains, trading above $0.45 on Friday after rallying more than 32% this week. On-chain data indicates further rally as XLM’s Open Interest and Total Value Locked rise. Additionally, the technical outlook suggests a rally continuation projection of further 40% gains.

Week ahead – US NFP to test the markets, Eurozone CPI data also in focus
King Dollar flexes its muscles ahead of Friday’s NFP. Eurozone flash CPI numbers awaited as euro bleeds. Canada’s jobs data to impact bets of a January BoC cut. Australia’s CPI and Japan’s wages also on tap.

Best Forex Brokers with Low Spreads
VERIFIED Low spreads are crucial for reducing trading costs. Explore top Forex brokers offering competitive spreads and high leverage. Compare options for EUR/USD, GBP/USD, USD/JPY, and Gold.
