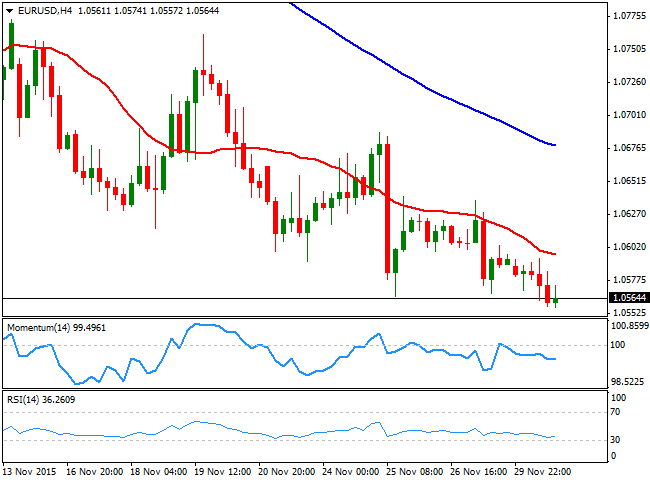
EUR/USD Current price: 1.0562
View Live Chart for the EUR/USD
The EUR/USD pair extended its decline by a handful of pips in this first day of the week, but remained confined to a tight intraday range amid investors being cautious ahead of the big events from this last month of the year. Ever since last week, the market has been pricing in the possibility that the ECB will announce, not only an extension of its QE, but further negative deposit rates in a desperate move to boost local growth. Also, the US will release this Friday its November employment data, which can confirm the case for a US rate hike this December. As for the data released this Monday, German Retail sales declined by 0.4% compared to the previous month, but rose by 2.1% compared to a year before. Inflation in the country rose by 0.1% in November, in line with expectations, and with the deflationary levels of the region. In the US, Pending Home sales were marginally higher in October, rising by 0.2%, although much less than expected, while the Chicago PMI for November fell to 48.7 from a previous 56.2.
The technical picture shows little progress from previous updates, as in the 4 hours chart, the price remains below a bearish 20 SMA, whilst the technical indicators remain below their mid-lines, although lacking clear strength at the time being. The pair stands at its lowest for the past 7-months, and market's sentiment is clearly bearish. A break below 1.0550 should favor some additional declines for this Tuesday, yet movement may remain limited intraday ahead of the big events to take place by the end of the week.
Support levels: 1.0550 1.0520 1.0485
Resistance levels: 1.0620 1.0660 1.0695
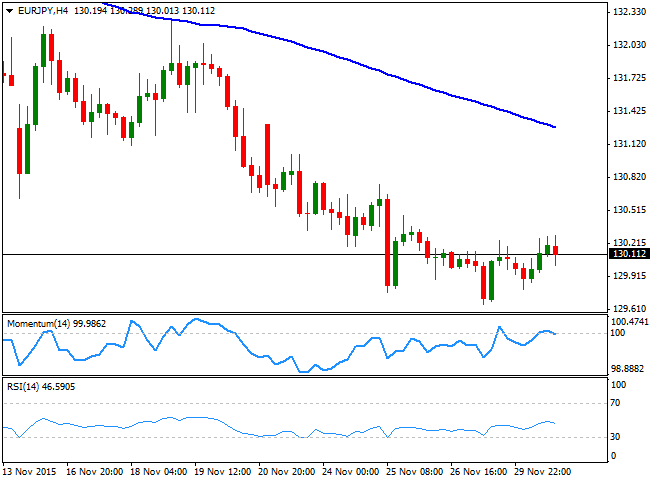
EUR/JPY Current price: 130.10
View Live Chart for the EUR/JPY
The EUR/JPY pair trades flat for a second day in-a-row, hovering around the 130.00 level, ever since the week started. The pair, however, has set a higher low and a higher high daily basis, which suggest a possible interim bottom under way, particularly if the price manages to recover above 131.00 during the next 24 hours. Short term, the 1 hour chart shows that the price is currently struggling to recover above a bearish 100 SMA, but that the technical indicators are heading higher above their mid-lines, keeping the downside limited. In the 4 hours chart, however, the technical outlook is neutral-to-bearish, given that the price is well below a bearish 100 SMA, currently around 131.10, while the technical indicators have turned lower around their mid-lines, showing no actual strength at the time being. A break below 129.65, should deny the possibility of an upward recovery and favor further declines, with 128.80 as the next bearish target.
Support levels: 129.65 129.20 128.80
Resistance levels: 130.55 130.90 131.30
GBP/USD Current price: 1.5054
View Live Chart for the GPB/USD
The Pound managed to bounce after testing the 1.5000 region against the greenback, with the pair having been as low as 1.4992 during the European morning. The bounce can be attributed to technical buying interest around the critical psychological figure rather than because of some sudden strength in the British currency. News were light in the UK, with the only release being some credit figures for October, showing that consumer credit decreased to £1.178B against previous £1.261B, while less mortgages than-expected were approved in the same month down to 69.63K against 68.87K previous. The GBP/USD recovered some 60 pips from the level, and the 4 hours chart shows that the recovery stalled below the 20 SMA that anyway has partially lost its bearish strength. In the same chart, the Momentum indicator has been rejected from its 100 level, while the RSI has recovered from oversold levels, but lost upward strength around 46, all of which maintains the risk towards the downside.
Support levels: 1.5050 1.5010 1.4980
Resistance levels: 1.5135 1.5170 1.5200
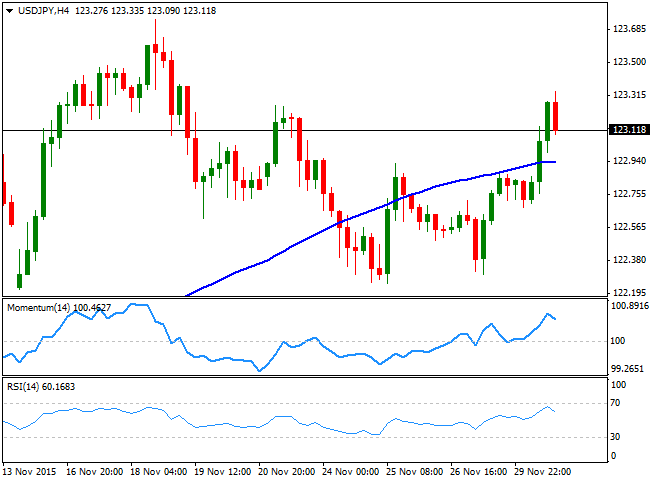
USD/JPY Current price: 123.11
View Live Chart for the USD/JPY
The USD/JPY pair surged to 123.33 this Monday, and managed to close the day with gains above the 123.00 level, helped by broad dollar's demand, despite tepid US data. The pair surged at the beginning of the European session, but held within its early November range. During the upcoming Asian session, Japan will release its November Manufacturing PMI figures while BOJ's governor Kuroda will offer a speech. Both will be closely followed as investors will be looking for any tip of a chance in the ongoing economic policy. From a technical point of view, the 1 hour chart shows that the price has recovered above its 100 and 200 SMAs, although the shorter stands below the largest, limiting chances of a more sustainable rally. In the same chart, the technical indicators are turning lower near overbought readings, also limiting advances. In the 4 hours chart, the technical indicators turned lower above their mid-lines, indicating some short term upward exhaustion at the time being. At this point, the pair needs to firm up above the 123.40 level to be able to extend its rally during the upcoming sessions.
Support levels: 122.60 122.20 121.70
Resistance levels: 123.40 123.75 124.40
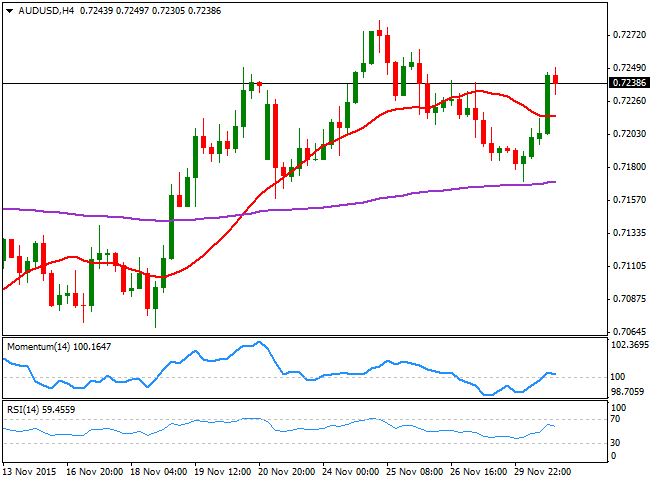
AUD/USD Current price: 0.7238
View Live Chart for the AUD/USD
The AUD/USD pair bottomed around 0.7169 at the beginning of the day, having been on a steady recovery for most of the day, and accelerating its recovery during the American afternoon, following a sharp intraday advance in gold prices. The latest Aussie strength will have to deal now with the RBA economic policy decision, and Glen Stevens words, during the upcoming Asian session, which should favor further the antipodean currency in the case of a dovish stance. In the meantime, the pair is fining some selling interest around a key static resistance level, the 0.7240 price zone. Technically, the 1 hour chart shows that the technical indicators have eased partially from overbought levels, but that the price remains well above a now bullish 20 SMA. In the 4 hours chart, the price is above a horizontal 20 SMA while the technical indicator have lost their upward strength after recovering above their mid-lines, suggesting further advances are required to confirm a more constructive outlook.
Support levels: 0.7200 0.7150 0.7110
Resistance levels: 0.7245 0.7285 0.7330
Information on these pages contains forward-looking statements that involve risks and uncertainties. Markets and instruments profiled on this page are for informational purposes only and should not in any way come across as a recommendation to buy or sell in these assets. You should do your own thorough research before making any investment decisions. FXStreet does not in any way guarantee that this information is free from mistakes, errors, or material misstatements. It also does not guarantee that this information is of a timely nature. Investing in Open Markets involves a great deal of risk, including the loss of all or a portion of your investment, as well as emotional distress. All risks, losses and costs associated with investing, including total loss of principal, are your responsibility. The views and opinions expressed in this article are those of the authors and do not necessarily reflect the official policy or position of FXStreet nor its advertisers. The author will not be held responsible for information that is found at the end of links posted on this page.
If not otherwise explicitly mentioned in the body of the article, at the time of writing, the author has no position in any stock mentioned in this article and no business relationship with any company mentioned. The author has not received compensation for writing this article, other than from FXStreet.
FXStreet and the author do not provide personalized recommendations. The author makes no representations as to the accuracy, completeness, or suitability of this information. FXStreet and the author will not be liable for any errors, omissions or any losses, injuries or damages arising from this information and its display or use. Errors and omissions excepted.
The author and FXStreet are not registered investment advisors and nothing in this article is intended to be investment advice.
Recommended Content
Editors’ Picks

EUR/USD stays near 1.0400 in thin holiday trading
EUR/USD trades with mild losses near 1.0400 on Tuesday. The expectation that the US Federal Reserve will deliver fewer rate cuts in 2025 provides some support for the US Dollar. Trading volumes are likely to remain low heading into the Christmas break.

GBP/USD struggles to find direction, holds steady near 1.2550
GBP/USD consolidates in a range at around 1.2550 on Tuesday after closing in negative territory on Monday. The US Dollar preserves its strength and makes it difficult for the pair to gain traction as trading conditions thin out on Christmas Eve.

Gold holds above $2,600, bulls non-committed on hawkish Fed outlook
Gold trades in a narrow channel above $2,600 on Tuesday, albeit lacking strong follow-through buying. Geopolitical tensions and trade war fears lend support to the safe-haven XAU/USD, while the Fed’s hawkish shift acts as a tailwind for the USD and caps the precious metal.

IRS says crypto staking should be taxed in response to lawsuit
In a filing on Monday, the US International Revenue Service stated that the rewards gotten from staking cryptocurrencies should be taxed, responding to a lawsuit from couple Joshua and Jessica Jarrett.

2025 outlook: What is next for developed economies and currencies?
As the door closes in 2024, and while the year feels like it has passed in the blink of an eye, a lot has happened. If I had to summarise it all in four words, it would be: ‘a year of surprises’.

Best Forex Brokers with Low Spreads
VERIFIED Low spreads are crucial for reducing trading costs. Explore top Forex brokers offering competitive spreads and high leverage. Compare options for EUR/USD, GBP/USD, USD/JPY, and Gold.


