EUR/USD Current price: 1.0690
View Live Chart for the EUR/USD
Currencies had, once again, little to offer to investors this Monday, as a limited volatility prevailed all through the sessions. The early risk aversion triggered by the terrorist attacks on France during the weekend, eased as the day went by, with safe havens giving back all of their intraday gains by the US close. In Europe, the release of October CPI figures showed that inflation remains subdued in the EU, up 0.1% monthly basis as expected, hardly affecting the market. In the US the November Empire State Manufacturing Survey indicated that business activity declined for a fourth consecutive month, resulting at -10.74 against the -6.00 expected. Nevertheless, the imbalance between both Central Banks continued leading the pair, which fell to fresh lows below the 1.0700 level by the end of the day.Technically, the short term picture favors further declines as the price develops well below a bearish 20 SMA, whilst the technical indicators head south below their mid-lines. In the 4 hours chart, the technical indicators gained bearish momentum after failing to overcome their mid-lines, whilst the price was unable to advance beyond a horizontal 20 SMA, currently around 1.0750. Should the price break below 1.0670, the multi-month low set last week, the bearish continuation may extend below the 1.0600 level this Tuesday.
Support levels: 1.0670 1.0630 1.0590
Resistance levels: 1.0715 1.0750 1.0790
EUR/JPY Current price: 131.74
View Live Chart for the EUR/JPY
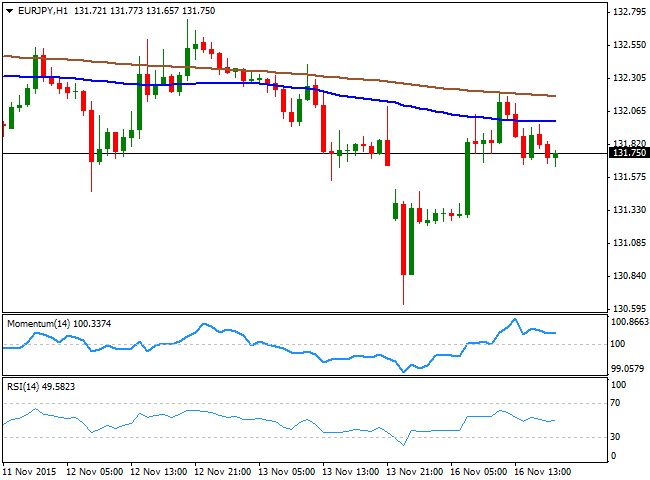
The EUR/JPY pair fell down to 130.63 at the weekly opening, as the Japanese yen strengthened on safe haven demand. The pair however, changed bias after the release of poor Japanese GDP figures that fueled speculation the BOJ will have no choice but to extend their stimulus program. Technically, the 1 hour chart shows that the price's recovery reached 132.20, where the 200 SMA attracted selling interest. Now trading also below the 100 SMA, the technical indicators in the same time frame continue retreating from overbought levels and maintain bearish slopes, but above their mid-lines. In the 4 hours chart, is clear that the pair has posted a lower low daily basis below a bearish 100 SMA, whilst the technical indicators turned lower below their mid-lines, maintaining the risk towards the downside.
Support levels: 131.30 130.90 130.55
Resistance levels: 132.30 132.60 133.10
GBP/USD Current price: 1.5208
View Live Chart for the GPB/USD
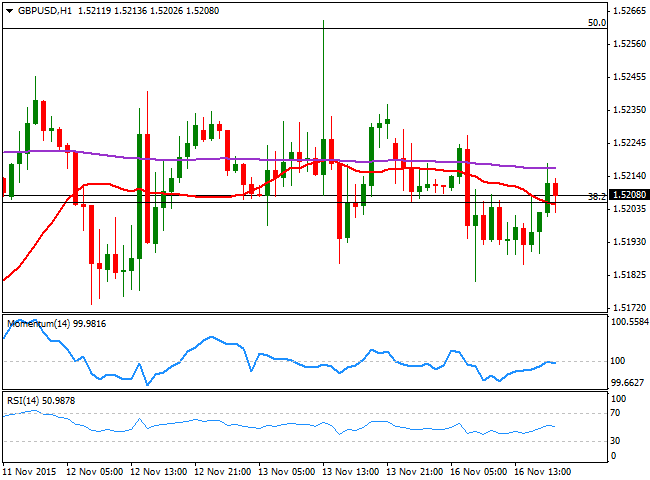
The GBP/USD pair fell down to 1.5180 at the beginning of the day, but ended the day pretty much unchanged above the 1.5200 level. The daily chart shows that, for a third day in-a-row, the pair has been unable to set a direction with long wicks in the daily candles and practically no bodies. The lack of UK macroeconomic data´s releases these last few days have also weighed on the pair, as investors are waiting for some clues on whether the BOE may act, or not, during the first half of 2016. This Tuesday, the kingdom will release retail and wholesale inflation data, expected to have improved during October. If the figures actually overcome expectations, the Pound may recover beyond last week high of 1.5263. In the meantime, the 1 hour chart presents a neutral stance, as the price is stuck around a flat 20 SMA whilst the technical indicators show no directional strength and remain around their mid-lines. In the 4 hours chart, the technical outlook is also neutral with the pair unable to firm up above the 38.2% retracement of its latest bearish run and the technical indicators also lacking directional strength around their mid-lines.
Support levels: 1.5160 1.5120 1.5070
Resistance levels: 1.5215 1.5265 1.5310
USD/JPY Current price: 123.17
View Live Chart for the USD/JPY
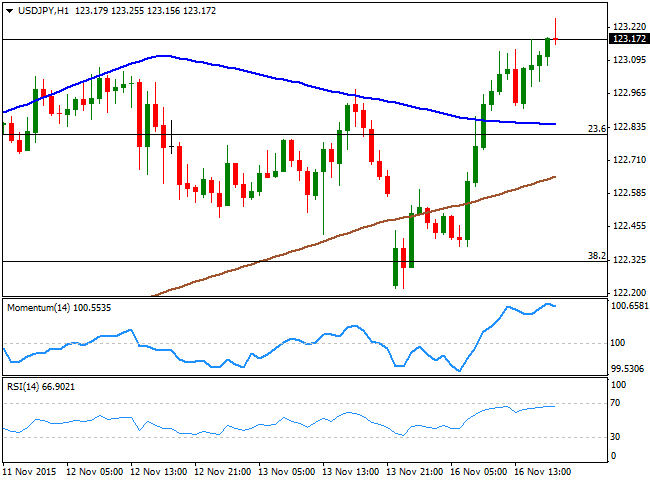
The USD/JPY pair fell down to 122.21 at the beginning of the day, as the Japanese yen was buoyed due to its safe haven condition. The currency, however, changed course after the release of the latest Japan GDP figures, showing that the economy contracted in the third quarter. Gross domestic product declined an annualized 0.8% in the three months to September, well beyond the 0.2% contraction forecast. The negative reading fueled hopes of a QE extension in Japan, leading to a steady advance in the pair which regained the 123.00 level in the European morning. The short term technical picture shows that the upward momentum has diminished, but that the upside remains favored, as in the 1 hour chart, the pair is well above its 100 and 200 SMAs, while the technical indicators are turning flat near overbought levels. In the 4 hours chart, the technical indicators present tepid bullish slopes above their mid-lines, whilst the price is well above its moving averages, all of which supports additional gains, particularly on a break above 123.55, last week high.
Support levels: 122.80 122.30 122.00
Resistance levels: 123.55 123.90 124.40
AUD/USD Current price: 0.7095
View Live Chart for the AUD/USD
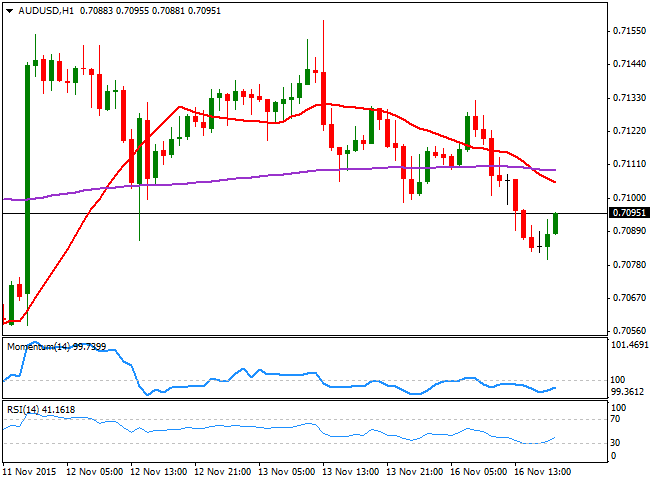
The AUD/USD pair ended the day a few pips below the 0.7100 level, with the Aussie unable to benefit from a strengthening gold. Overall, commodity-related currencies edged lower, following the negative mood among stocks, although the AUD/USD pair decline was contained by buying interest around 0.7080. The RBA will release the Minutes of its latest economic policy meeting during the upcoming Asian session, which will likely determinate the fate of the currency. In the meantime, the 1 hour chart shows that the price has bounced from the mentioned low, but remains below a bearish 20 SMA, whilst the technical indicators remain in negative territory, limiting chances of a stronger recovery. In the 4 hours chart, the price is also below its 20 SMA that anyway maintains a bullish slope, whilst the technical indicators have turned slightly higher, but are still below their mid-lines. The immediate support comes at 0.7070, with a break below it required to confirm a continued decline towards the 0.6990 price zone.
Support levels: 0.7070 0.7030 0.6990
Resistance levels: 0.7150 0.7190 0.7240
Information on these pages contains forward-looking statements that involve risks and uncertainties. Markets and instruments profiled on this page are for informational purposes only and should not in any way come across as a recommendation to buy or sell in these assets. You should do your own thorough research before making any investment decisions. FXStreet does not in any way guarantee that this information is free from mistakes, errors, or material misstatements. It also does not guarantee that this information is of a timely nature. Investing in Open Markets involves a great deal of risk, including the loss of all or a portion of your investment, as well as emotional distress. All risks, losses and costs associated with investing, including total loss of principal, are your responsibility. The views and opinions expressed in this article are those of the authors and do not necessarily reflect the official policy or position of FXStreet nor its advertisers. The author will not be held responsible for information that is found at the end of links posted on this page.
If not otherwise explicitly mentioned in the body of the article, at the time of writing, the author has no position in any stock mentioned in this article and no business relationship with any company mentioned. The author has not received compensation for writing this article, other than from FXStreet.
FXStreet and the author do not provide personalized recommendations. The author makes no representations as to the accuracy, completeness, or suitability of this information. FXStreet and the author will not be liable for any errors, omissions or any losses, injuries or damages arising from this information and its display or use. Errors and omissions excepted.
The author and FXStreet are not registered investment advisors and nothing in this article is intended to be investment advice.
Recommended Content
Editors’ Picks

EUR/USD holds above 1.0400 in quiet trading
EUR/USD trades in positive territory above 1.0400 in the American session on Friday. The absence of fundamental drivers and thin trading conditions on the holiday-shortened week make it difficult for the pair to gather directional momentum.

GBP/USD recovers above 1.2550 following earlier decline
GBP/USD regains its traction and trades above 1.2550 after declining toward 1.2500 earlier in the day. Nevertheless, the cautious market mood limits the pair's upside as trading volumes remain low following the Christmas break.

Gold declines below $2,620, erases weekly gains
Gold edges lower in the second half of the day and trades below $2,620, looking to end the week marginally lower. Although the cautious market mood helps XAU/USD hold its ground, growing expectations for a less-dovish Fed policy outlook caps the pair's upside.

Bitcoin misses Santa rally even as on-chain metrics show signs of price recovery
Bitcoin (BTC) price hovers around $97,000 on Friday, erasing most of the gains from earlier this week, as the largest cryptocurrency missed the so-called Santa Claus rally, the increase in prices prior to and immediately following Christmas Day.

2025 outlook: What is next for developed economies and currencies?
As the door closes in 2024, and while the year feels like it has passed in the blink of an eye, a lot has happened. If I had to summarise it all in four words, it would be: ‘a year of surprises’.

Best Forex Brokers with Low Spreads
VERIFIED Low spreads are crucial for reducing trading costs. Explore top Forex brokers offering competitive spreads and high leverage. Compare options for EUR/USD, GBP/USD, USD/JPY, and Gold.
