EUR/USD Current price: 1.0770
View Live Chart for the EUR/USD
The EUR/USD pair closed last week with a 30 pips gain, having traded in a very limited range these last days, as the dominant bearish trend, due to the widening imbalances between Central Banks, remains firm in place. Even more, the fact that US data released last Friday was far from encouraging, and even so, the greenback refused to ease, suggests fresh lows are likely for this week. US Retail Sales and the wholesale inflation came out below expected, triggering a short-lived slide in the American currency. Nevertheless, in Europe, things weren't better, as German and the EU GDP figures showed limited growth in the region during the third quarter.Technically, and according to the daily chart, the pair has barely corrected the extreme oversold readings reached after the release of US employment data a week ago. In the same chart, the Momentum indicator aims higher, but remains below its mid-line, whilst the 20 SMA has extended its decline below the 100 and 200 SMAs, and remains far above the current level, all of which supports the ongoing bearish trend. In the 4 hours chart, the price has been moving back and forth around a horizontal 20 SMA, whilst the technical indicators head slightly higher around their mid-lines, lacking upward strength. Selling interest has contained advances in the 1.0800/10 price zone, yet even some follow though beyond the level won't affect the trend, as only a recovery above 1.1000 will mark and interim bottom under way.
Support levels: 1.0745 1.0690 1.0650
Resistance levels: 1.0810 1.0850 1.0890
EUR/JPY Current price: 131.66
View Live Chart for the EUR/JPY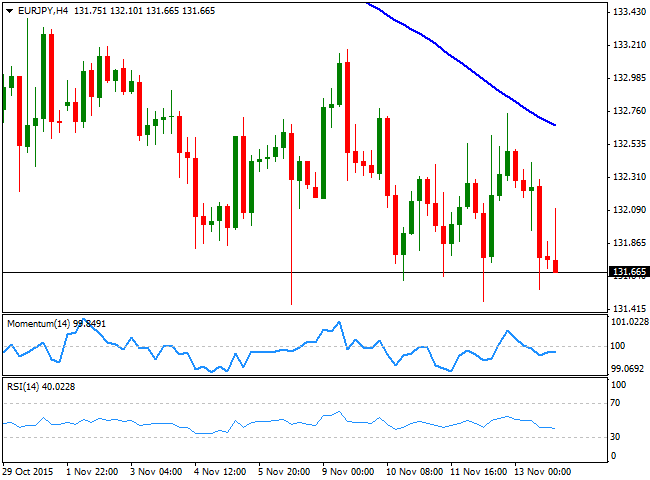
The EUR/JPY pair closed last Friday a few pips above the multi-month low set at 121.44 early November, at 131.66. The Japanese yen posted modest advances against all of it major rivals last week, as BOJ board member Yutaka Harada, suggested there's no imminent need for additional easing, despite inflation is still far from the Central Bank´s target. Daily basis, the technical picture favors the downside, given that the price is far below its 100 and 200 SMAs, whilst the Momentum indicators is unable to advance beyond its 100 level and the RSI indicator turned lower around 35. In the 4 hours chart, the pair has met selling interest on approaches to a strongly bearish 100 SMA, currently at 132.60, whilst the technical indicators stand below their mid-lines, albeit lacking direction strength at the time being.
Support levels: 131.30 130.90 130.55
Resistance levels: 132.00 132.60 133.10
GBP/USD Current price: 1.5232
View Live Chart for the GPB/USD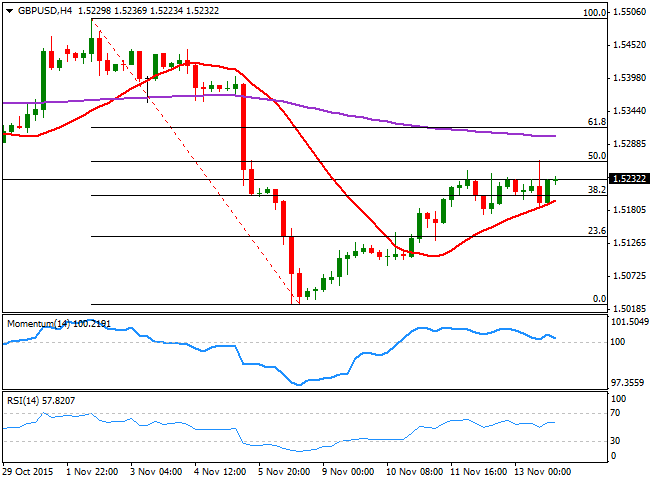
The GBP/USD pair managed to recover some ground this past week, having advanced up to 1.5263, the 50% retracement of its latest daily fall. The pair run into the level following the release of weaker-than-expected macroeconomic data in the US, and found buyers on a pullback below the 1.5200 level. The Pound has recovered part of its charm, after taking a hit from the latest BOE's economic policy meeting, in which the Central Bank downgraded its growth and inflation forecasts, diminishing chances of a rate hike for the first half of 2016 in the UK. Nevertheless, the GBP is still among the strongest currencies across the board, and the first to gain on dollar's weakness. Technically, the daily chart shows that the technical indicators have extended their recoveries from oversold levels, but also that the upward momentum faded before they cross towards positive territory. In the same chart, the 20 SMA maintains a strong bearish slope a few pips above the mentioned high, all of which limits chances of a stronger rally at the time being. Shorter term, the 4 hours chart shows that the price is above a firmly bullish 20 SMA, but that the technical indicators lack upward strength and are barely holding above their mid-lines. The 61.8% retracement of the November's decline stands at 1.5315, and it will take a break above it to confirm a continued upward move during the upcoming days.
Support levels: 1.5195 1.5160 1.5120
Resistance levels: 1.5266 1.5315 1.5350
USD/JPY Current price: 122.58
View Live Chart for the USD/JPY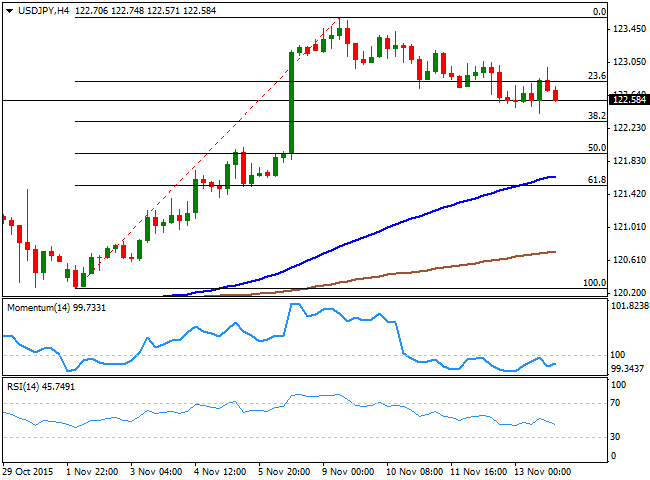
The USD/JPY pair closed last Friday at 122.58, having retraced half of the gains achieved in the NFP Friday, on speculation the Bank of Japan may refrain from extending the monetary stimulus program, at least for the rest of the current fiscal year. Also, soft US macroeconomic data has prevented the greenback from running these last few days, although the confirmation of a technical top remains for now, out of the question. Technically, the daily chart for the USD/JPY shows that the price is now below the 23.6% retracement of its latest advance, whilst the technical indicators have retraced from overbought level and hold far above their mid-lines, implying limited bearish potential at the time being. In the same chart, the 100 and 200 SMA's converge with the 61.8% retracement of the same rally at 121.50, becoming a critical support during the upcoming days. In the 4 hours chart, the technical indicators diverge from each other in negative territory, but the price remains well above its moving averages. The 38.2% retracement of the mentioned rally stands at 122.30 the immediate support and the level to break to confirm further declines for this Monday.
Support levels: 122.30 122.00 121.75
Resistance levels: 122.80 123.10 123.45
AUD/USD Current price: 0.7117
View Live Chart for the AUD/USD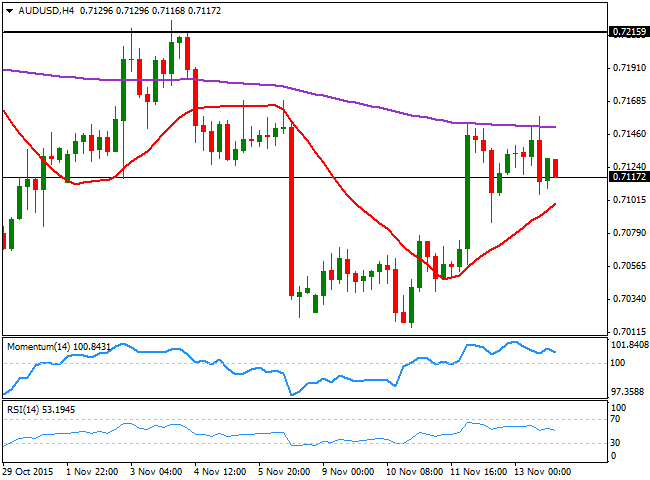
The AUD/USD pair reversed course last week, closing with gains after falling for four weeks in-a-row. The Australian dollar got a nice boost from a shockingly positive local employment report, which showed that the country added over 58K new jobs last October. Investors took some profits out of the table on Friday, but the pair held to most of its weekly gains and closed above the 0.7100 level. The daily chart shows that an upward continuation can't yet be confirmed, given that the price retreated at least twice from a bearish 20 SMA, whilst the Momentum indicator holds around its 100 level, and the RSI turns south around 48. In the 4 hours chart, the price has failed to advance beyond the 200 EMA, currently at 0.7150 and the immediate resistance, but remains above a bullish 20 SMA, whilst the technical indicators turned south in positive territory. A candle opening above the mentioned level should favor further gains for the upcoming sessions, with 0.7240 as the next strong static resistance level to watch.
Support levels: 0.7100 0.7070 0.7030
Resistance levels: 0.7150 0.7190 0.7240
Information on these pages contains forward-looking statements that involve risks and uncertainties. Markets and instruments profiled on this page are for informational purposes only and should not in any way come across as a recommendation to buy or sell in these assets. You should do your own thorough research before making any investment decisions. FXStreet does not in any way guarantee that this information is free from mistakes, errors, or material misstatements. It also does not guarantee that this information is of a timely nature. Investing in Open Markets involves a great deal of risk, including the loss of all or a portion of your investment, as well as emotional distress. All risks, losses and costs associated with investing, including total loss of principal, are your responsibility. The views and opinions expressed in this article are those of the authors and do not necessarily reflect the official policy or position of FXStreet nor its advertisers. The author will not be held responsible for information that is found at the end of links posted on this page.
If not otherwise explicitly mentioned in the body of the article, at the time of writing, the author has no position in any stock mentioned in this article and no business relationship with any company mentioned. The author has not received compensation for writing this article, other than from FXStreet.
FXStreet and the author do not provide personalized recommendations. The author makes no representations as to the accuracy, completeness, or suitability of this information. FXStreet and the author will not be liable for any errors, omissions or any losses, injuries or damages arising from this information and its display or use. Errors and omissions excepted.
The author and FXStreet are not registered investment advisors and nothing in this article is intended to be investment advice.
Recommended Content
Editors’ Picks

EUR/USD recovers above 1.0300, markets await comments from Fed officials
EUR/USD gains traction and trades above 1.0300 on Thursday despite mixed German Industrial Production and Eurozone Retail Sales data. Retreating US bond yields limits the USD's gains and allows the pair to hold its ground as market focus shifts to Fedspeak.
GBP/USD rebounds from multi-month lows, trades above 1.2300
GBP/USD erases a portion of its daily gains and trades above 1.2300 after setting a 14-month-low below 1.2250. The pair recovers as the UK gilt yields correct lower after surging to multi-year highs on a two-day gilt selloff. Markets keep a close eye on comments from central bank officials.

Gold climbs to new multi-week high above $2,670
Gold extends its weekly recovery and trades at its highest level since mid-December above $2,670. The benchmark 10-year US Treasury bond yield corrects lower from the multi-month high it touched above 4.7% on Wednesday, helping XAU/USD stretch higher.

Bitcoin falls below $94,000 as over $568 million outflows from ETFs
Bitcoin continues to edge down, trading below the $94,000 level on Thursday after falling more than 5% this week. Bitcoin US spot Exchange Traded Funds recorded an outflow of over $568 million on Wednesday, showing signs of decreasing demand.

Recent developments in the global economy
United States: Recent business surveys suggest that the clean election outcome has led companies that delayed investment and hiring due to election/regulatory uncertainty to start putting money to work.

Best Forex Brokers with Low Spreads
VERIFIED Low spreads are crucial for reducing trading costs. Explore top Forex brokers offering competitive spreads and high leverage. Compare options for EUR/USD, GBP/USD, USD/JPY, and Gold.
