EUR/USD Current price: 1.0854
View Live Chart for the EUR/USD
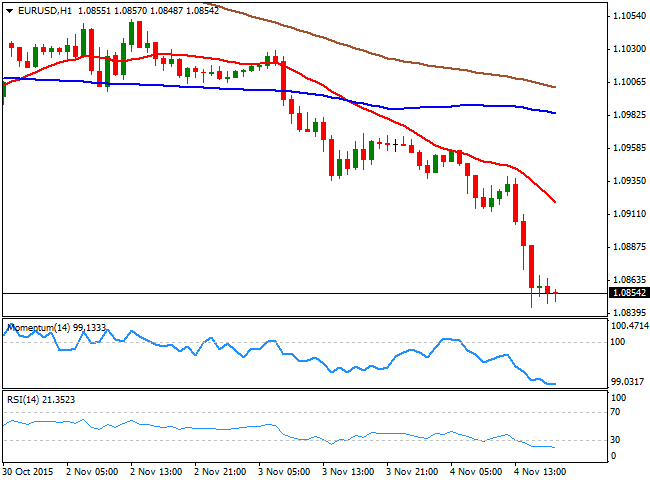
A bout of positive US data, alongside with FED's Yellen stating that the FOMC thought it could be appropriate to move in December, but that no decision was made, sent the EUR/USD pair to its lowest since late July. Data were clearly supportive of the greenback, as the ADP private employment survey showed that the economy managed to add 182K new jobs during October, slightly better than the expected 180K. The trade gap in September, shank to a 7-month low, printing a deficit of $40.8 billion from a revised $48 billion in August, whilst the Markit Services PMI beat expectations by resulting at 54.8.The common currency was already under pressure ahead of the American opening, as late Tuesday, Mario Draghi from the ECB reaffirmed that that the degree of monetary policy accommodation needs to be re-examined next December. The pair sunk to 1.0844 and trades a few pips above the level by the end of the day, maintaining a strong bearish tone, although extremely oversold in the short term. According to the 1 hour chart, however, there are no signs that the pair may correct higher, given that the technical indicators continue heading south in extreme levels, whilst the 20 SMA has accelerated its decline above the current level. In the 4 hours chart, the 20 SMA has turned lower well above the current level, whilst the Momentum indicator has lost its bearish strength well below the 100 level, whilst the RSI indicator hovers around 25. The pair has posted its lowest since late May at 1.0818, which means large stops could stand below it and therefore, if those got triggered, fuel the decline.
Support levels: 1.0845 1.0815 1.0770
Resistance levels: 1.0890 1.0920 1.0960
EUR/JPY Current price: 131.89
View Live Chart for the EUR/JPY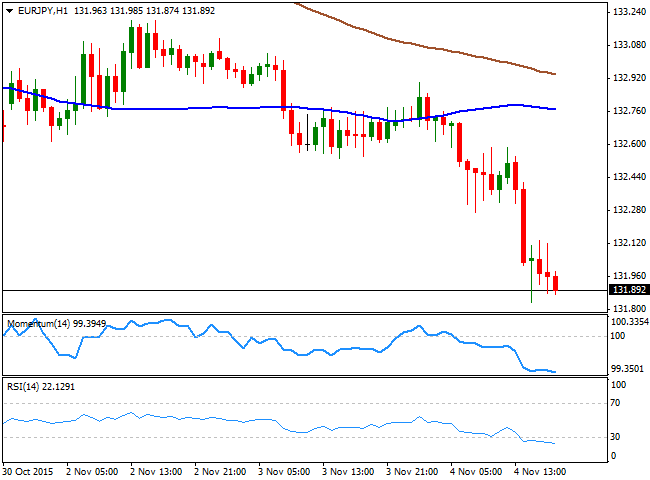
The EUR/JPY pair has lost almost 100 pips this Wednesday, led by EUR weakness, and as the JPY remain immune to dollar's demand ahead of US Nonfarm Payroll report next Friday. The pair has declined down to 131.83, approaching the year low posted last October at 131.57, and presenting a strong bearish short term tone, despite being overbought. The 1 hour chart shows that the price extended its decline well below its 100 SMA whilst the 200 SMA has approached to the last from above, reflecting the ongoing selling interest, and the technical indicators maintain their bearish slopes, despite being in overbought territory. In the 4 hours chart, the technical picture also supports a continued decline, as the RSI indicator heads south around 32, whilst the Momentum indicator remains well below its 100 level.
Support levels: 131.60 131.20 130.70
Resistance levels: 132.40 132.85 133.30
GBP/USD Current price: 1.5363
View Live Chart for the GPB/USD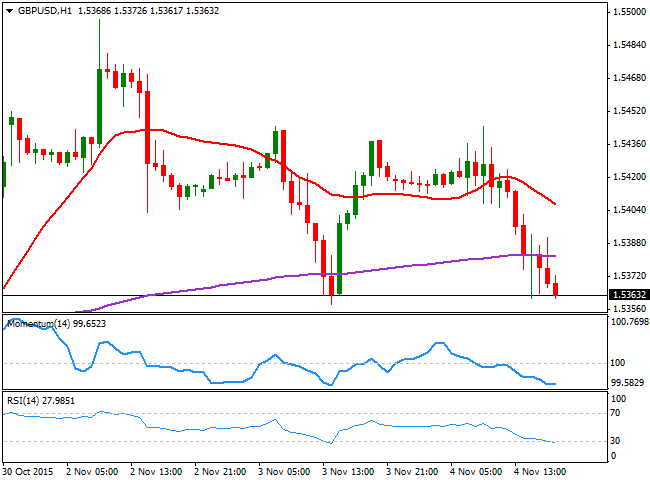
The GBP/USD pair fell down towards its weekly low during the American afternoon, as dollar's demand resumed in the light of better-than-expected US data and renewed hopes on a US rate hike next December. Earlier in the day, the UK Services PMI final reading resulted better-than-expected, printing 54.9 against the previous 53.3, sending the pair up to its weekly high of 1.5444, but the Pound finally succumbed, accelerating its decline after breaching the 1.5400 figure. The Bank of England will have its monthly economic meeting this Thursday, alongside with the release of the latest Inflation Report of the year, all of which is set to trigger some interesting moves in the pair, depending on how hawkish/dovish, the result is. In the meantime, the short term picture is bearish, as in the price is developing below a bearish 20 SMA in the 1 hour chart, while the technical indicators head lower near oversold levels. In the 4 hours chart, the price is a few pips below its 200 EMA, while the technical indicators head south below their mid-lines, supporting additional declines in the case of a downward acceleration below 1.5360, the immediate support.
Support levels: 1.5360 1.5330 1.5385
Resistance levels: 1.5400 1.5445 1.5480
USD/JPY Current price: 121.53
View Live Chart for the USD/JPY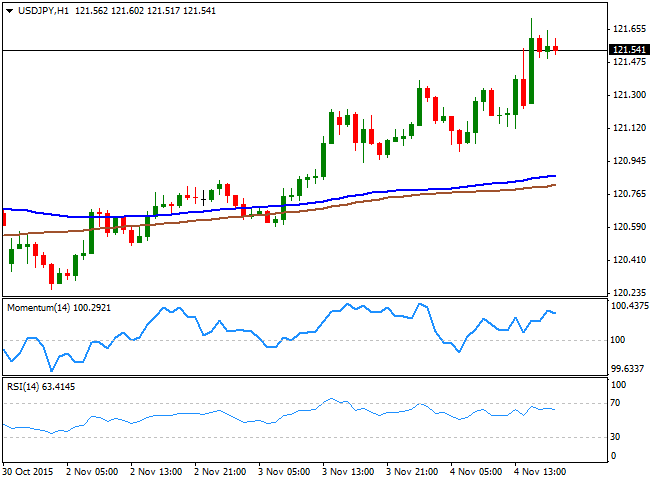
The USD/JPY pair advanced up to 121.71, its highest since late August, but added barely 50 pips this Wednesday, as investors are reluctant to push the pair much higher ahead of the release of US Nonfarm Payroll data next Friday. Nevertheless, the pair holds near its daily highs, and hovers now around its 100 DMA, testing the moving average for the first time in over two months. The short term picture is clearly bullish, as the 1 hour chart shows that the pair has extended well above its moving averages, but further advances are not yet confirmed, given that the technical indicators have lost their upward strength and turned lower, but well above their mid-lines. In the 4 hours chart, the technical indicators are also retreating partially from overbought levels, but with the price near its highs and well above its moving averages, the downside will likely remain limited this Thursday.
Support levels: 121.25 120.90 120.35
Resistance levels: 121.45 121.80 122.25
AUD/USD Current price: 0.7136
View Live Chart for the AUD/USD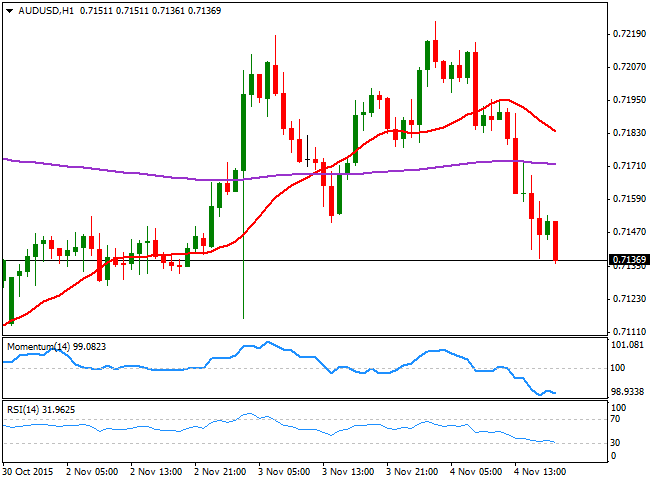
The Australian dollar enjoyed some demand at the beginning of the day, advancing against its American rival up to 0.7223, a fresh weekly high, helped by an early advance in oil prices and a positive close in local share markets. But the dollar's strength has finally taken its toll over the pair that trades around its daily low of 0.7135. Short term, the 1 hour chart supports a continued decline, as the price has extended well below a bearish 20 SMA, whilst the technical indicators present strong bearish slopes at fresh weekly lows and near oversold levels. In the 4 hours chart, the pair has extended further below its 200 EMA, and also stands below its 20 SMA, whilst the Momentum indicator has turned flat around its 100 level, and the RSI indicator heads lower around 44, increasing chances of additional declines, but not yet confirming a bearish move during the upcoming session.
Support levels: 0.7110 0.7075 0.7030
Resistance levels: 0.7160 0.7195 0.7240
Information on these pages contains forward-looking statements that involve risks and uncertainties. Markets and instruments profiled on this page are for informational purposes only and should not in any way come across as a recommendation to buy or sell in these assets. You should do your own thorough research before making any investment decisions. FXStreet does not in any way guarantee that this information is free from mistakes, errors, or material misstatements. It also does not guarantee that this information is of a timely nature. Investing in Open Markets involves a great deal of risk, including the loss of all or a portion of your investment, as well as emotional distress. All risks, losses and costs associated with investing, including total loss of principal, are your responsibility. The views and opinions expressed in this article are those of the authors and do not necessarily reflect the official policy or position of FXStreet nor its advertisers. The author will not be held responsible for information that is found at the end of links posted on this page.
If not otherwise explicitly mentioned in the body of the article, at the time of writing, the author has no position in any stock mentioned in this article and no business relationship with any company mentioned. The author has not received compensation for writing this article, other than from FXStreet.
FXStreet and the author do not provide personalized recommendations. The author makes no representations as to the accuracy, completeness, or suitability of this information. FXStreet and the author will not be liable for any errors, omissions or any losses, injuries or damages arising from this information and its display or use. Errors and omissions excepted.
The author and FXStreet are not registered investment advisors and nothing in this article is intended to be investment advice.
Recommended Content
Editors’ Picks

EUR/USD holds above 1.0400 in quiet trading
EUR/USD trades in positive territory above 1.0400 in the American session on Friday. The absence of fundamental drivers and thin trading conditions on the holiday-shortened week make it difficult for the pair to gather directional momentum.

GBP/USD recovers above 1.2550 following earlier decline
GBP/USD regains its traction and trades above 1.2550 after declining toward 1.2500 earlier in the day. Nevertheless, the cautious market mood limits the pair's upside as trading volumes remain low following the Christmas break.

Gold declines below $2,620, erases weekly gains
Gold edges lower in the second half of the day and trades below $2,620, looking to end the week marginally lower. Although the cautious market mood helps XAU/USD hold its ground, growing expectations for a less-dovish Fed policy outlook caps the pair's upside.

Bitcoin misses Santa rally even as on-chain metrics show signs of price recovery
Bitcoin (BTC) price hovers around $97,000 on Friday, erasing most of the gains from earlier this week, as the largest cryptocurrency missed the so-called Santa Claus rally, the increase in prices prior to and immediately following Christmas Day.

2025 outlook: What is next for developed economies and currencies?
As the door closes in 2024, and while the year feels like it has passed in the blink of an eye, a lot has happened. If I had to summarise it all in four words, it would be: ‘a year of surprises’.

Best Forex Brokers with Low Spreads
VERIFIED Low spreads are crucial for reducing trading costs. Explore top Forex brokers offering competitive spreads and high leverage. Compare options for EUR/USD, GBP/USD, USD/JPY, and Gold.
