EUR/USD Current price: 1.1059
View Live Chart for the EUR/USD
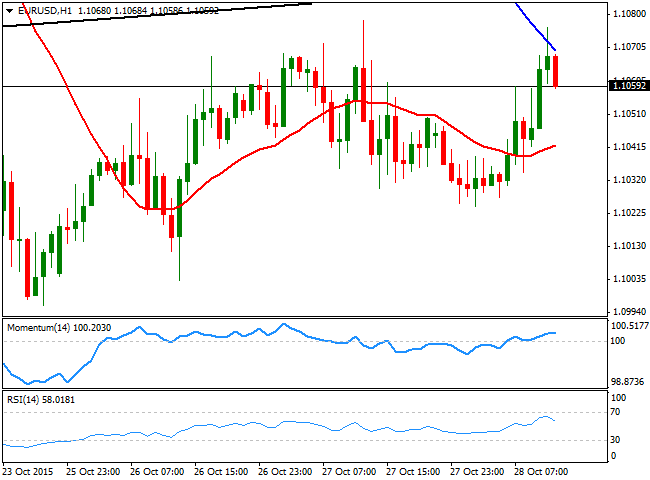
The EUR/USD pair retreats from daily high of 1.1076 ahead of the US opening, having got a short term boost from some ECB's officers, commenting on the future of the region economic policies. The macroeconomic calendar has been pretty quiet so far in the day, with the only piece of data released in Europe being the German import price index, which fell by 4.0% yearly basis, reflecting the slowdown in the EU largest economy. Investors however, are holding their breath ahead of the US Federal Reserve decision over its economic policy, to be announced later today. The pair has been confined to a tight range ever since the week started, for the most consolidating around the 1.1050 figure.Technically, the 1 hour chart shows that the price tested a bearish 100 SMA before retreating, whilst the technical indicators have lost their upward strength above their mid-lines. In the 4 hours chart, the price is above a flat 20 SMA, whilst the Momentum indicator is turning south around the 100 level, and the RSI hovers around 41. Overall, the bearish tone set last Thursday by the ECB remains firm in place, although whether it can extend or not, depends on whatever the FOMC announces today. Markets are waiting for a mild dovish tone, which means that some encouraging comments over a rate hike before the year end, can well sent the pair lower towards fresh lows through the 1.1000 level.
Support levels: 1.1000 1.0960 1.0920
Resistance levels: 1.1080 1.1120 1.1160
GBP/USD Current price: 1.5283
View Live Chart for the GPB/USD
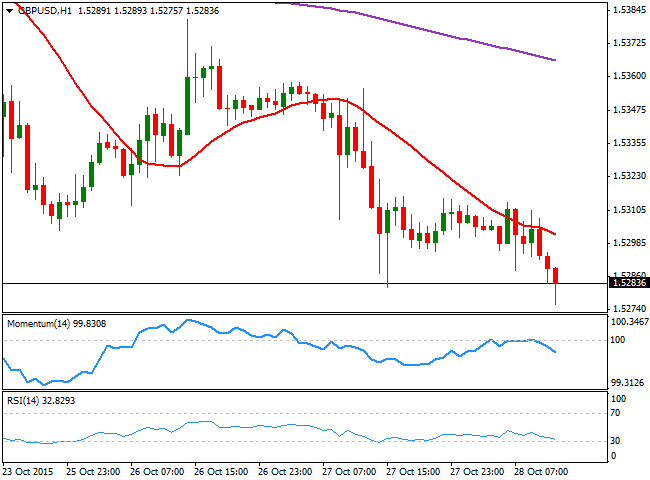
The GBP/USD pair extended its weekly decline by a handful of pips, down to 1.5275 so far this Wednesday, and trading a few pips above the level. There has been no relevant data released in the UK, but the Pound has been weighed by the slide in commodities' prices. The short term picture is bearish as in the 1 hour chart, the price has failed to advance above a still bearish 20 SMA, whilst the technical indicators have extended their declines into negative territory. In the 4 hours chart, the 20 SMA heads sharply lower above the current level, whilst the RSI indicator approaches oversold levels, all of which supports a continued decline towards the 1.5200 region.
Support levels: 1.5280 1.5250 1.5210
Resistance levels: 1.5320 1.5355 1.5390
USD/JPY Current price: 120.32
View Live Chart for the USD/JPY
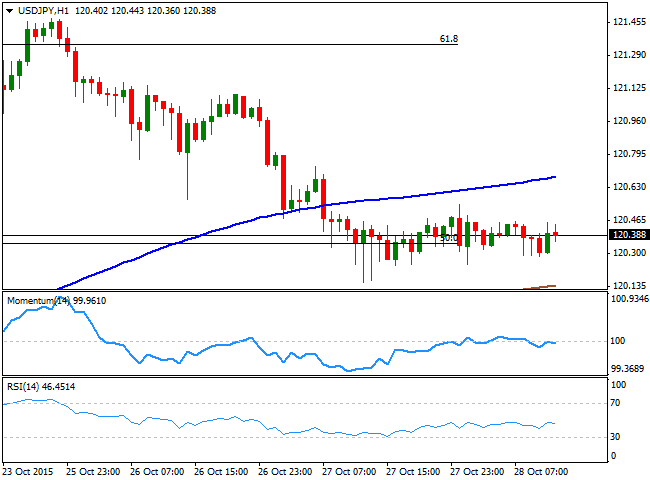
The USD/JPY pair trades flat around 120.35 ever since the day started, as investors are waiting not only for the US Central Bank decision, but also for the upcoming BOJ meeting outcome early Friday. Against the usual, the pair can see limited reactions post-FED, and even return to the current level after the dust settles, particularly if the US Central Bank offers no news. Technically, the pair lacks directional strength, with the 1 hour chart showing the price trapped between its 100 and 200 SMAs, and the technical indicators hovering around their mid-lines. In the 4 hours chart, the RSI indicator heads nowhere around 46, while the Momentum indicator continues correcting higher, but below its mid-line. Should the FED be a big disappointment the pair can break through the 120.00 support and extend its decline down to the 119.30 region, where some buying interest is expected to surge. Above 120.70 on the other hand, the rally can extend up to 121.30/50, where the 200 DMA should continue to cap the upside.
Support levels: 120.00 119.65 119.30
Resistance levels: 120.65 121.00 121.40
AUD/USD Current price: 0.7129
View Live Chart for the AUD/USD
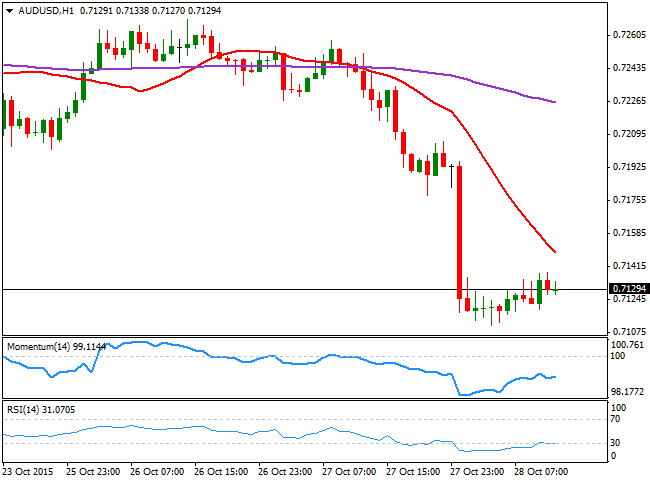
The Aussie plunged after the release of the third quarter local inflation readings, much worse-than-expected. Trimmed CPI for the mentioned period came out at 0.3% against previous 0.6% and expectations of 0.5%, leaving the yearly figure at 2.1%, against the expected 2.4%. The AUD/USD pair fell down to 0.7110, and has barely bounced from the level afterwards, consolidating some 20 pips above the mentioned low. The 1 hour chart shows that the technical indicators have managed to correct the extreme oversold readings reached after the release, but that they remain well below their mid-lines. In the same chart, the 20 SMA heads sharply lower, providing an immediate resistance around 0.7150. In the 4 hours chart, the bearish potential is still strong, given that the 20 SMA has turned strongly lower well above the current level, whilst the technical indicators remain near oversold levels.
Support levels: 0.7110 0.7070 0.7035
Resistance levels: 0.7150 0.7195 0.7240
Information on these pages contains forward-looking statements that involve risks and uncertainties. Markets and instruments profiled on this page are for informational purposes only and should not in any way come across as a recommendation to buy or sell in these assets. You should do your own thorough research before making any investment decisions. FXStreet does not in any way guarantee that this information is free from mistakes, errors, or material misstatements. It also does not guarantee that this information is of a timely nature. Investing in Open Markets involves a great deal of risk, including the loss of all or a portion of your investment, as well as emotional distress. All risks, losses and costs associated with investing, including total loss of principal, are your responsibility. The views and opinions expressed in this article are those of the authors and do not necessarily reflect the official policy or position of FXStreet nor its advertisers. The author will not be held responsible for information that is found at the end of links posted on this page.
If not otherwise explicitly mentioned in the body of the article, at the time of writing, the author has no position in any stock mentioned in this article and no business relationship with any company mentioned. The author has not received compensation for writing this article, other than from FXStreet.
FXStreet and the author do not provide personalized recommendations. The author makes no representations as to the accuracy, completeness, or suitability of this information. FXStreet and the author will not be liable for any errors, omissions or any losses, injuries or damages arising from this information and its display or use. Errors and omissions excepted.
The author and FXStreet are not registered investment advisors and nothing in this article is intended to be investment advice.
Recommended Content
Editors’ Picks

EUR/USD clings to daily gains near 1.0300 after US PMI data
EUR/USD trades in positive territory at around 1.0300 on Friday. The pair breathes a sigh of relief as the US Dollar rally stalls, even as markets stay cautious amid geopolitical risks and Trump's tariff plans. US ISM PMI improved to 49.3 in December, beating expectations.

GBP/USD holds around 1.2400 as the mood improves
GBP/USD preserves its recovery momentum and trades around 1.2400 in the American session on Friday. A broad pullback in the US Dollar allows the pair to find some respite after losing over 1% on Thursday. A better mood limits US Dollar gains.

Gold retreats below $2,650 in quiet end to the week
Gold shed some ground on Friday after rising more than 1% on Thursday. The benchmark 10-year US Treasury bond yield trimmed pre-opening losses and stands at around 4.57%, undermining demand for the bright metal. Market players await next week's first-tier data.

Stellar bulls aim for double-digit rally ahead
Stellar extends its gains, trading above $0.45 on Friday after rallying more than 32% this week. On-chain data indicates further rally as XLM’s Open Interest and Total Value Locked rise. Additionally, the technical outlook suggests a rally continuation projection of further 40% gains.

Week ahead – US NFP to test the markets, Eurozone CPI data also in focus
King Dollar flexes its muscles ahead of Friday’s NFP. Eurozone flash CPI numbers awaited as euro bleeds. Canada’s jobs data to impact bets of a January BoC cut. Australia’s CPI and Japan’s wages also on tap.

Best Forex Brokers with Low Spreads
VERIFIED Low spreads are crucial for reducing trading costs. Explore top Forex brokers offering competitive spreads and high leverage. Compare options for EUR/USD, GBP/USD, USD/JPY, and Gold.
