EUR/USD Current price: 1.1041
View Live Chart for the EUR/USD
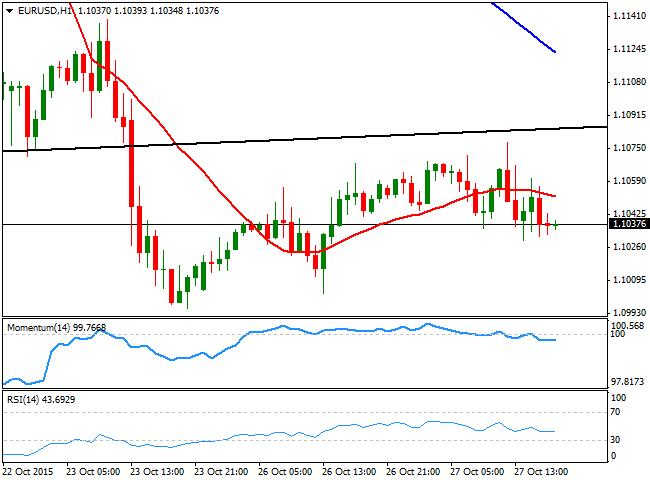
With the EUR/USD and the USD/JPY pairs being the exception, the dollar traded firmly higher against all of its major rivals, in a Tuesday dominated by risk aversion since the Asian session opening. The American currency rallied as commodities prices fell sharply lower, and despite US data was far from encouraging. In Europe, money supply data showed that credit to local businesses fell back in September to 0.1% yearly basis, from a previous 0.4%, which helped keep the pair limited around 1.1050 for most of the European morning. In the US, Durable Goods Orders fell 1.2% in September, the second straight drop, amid softness in the manufacturing sector. The Markit Flash Services PMI eased to 54.4 in October from the previous 55.1, while Consumer Confidence in the same month, fell down to 97.6 from a previously revised 102.6.
The pair traded within 50 pips and closed slightly lower, after completing a pullback to the long term ascendant trend line broken last week, at 1.1080. The technical stance is bearish, albeit the US Federal Reserve will have its monthly economic meeting late Wednesday and the market will probably trade on sentiment rather than technical. Anyway, and for the upcoming hours, the 1 hour chart shows that the price is below its 20 SMA, whilst the technical indicators show no actual strength, but hold in negative territory. In the 4 hours chart, the Momentum indicator extended its advance and is currently around its 100 level, but the price was unable to hold gains above a strongly bearish 20 SMA whilst the RSI indicator turned back south after correcting extreme oversold readings, all of which supports further declines on a break below the 1.1000 figure.
Support levels: 1.1000 1.0960 1.0920
Resistance levels: 1.1080 1.1120 1.1160
EUR/JPY Current price: 132.80
View Live Chart for the EUR/JPY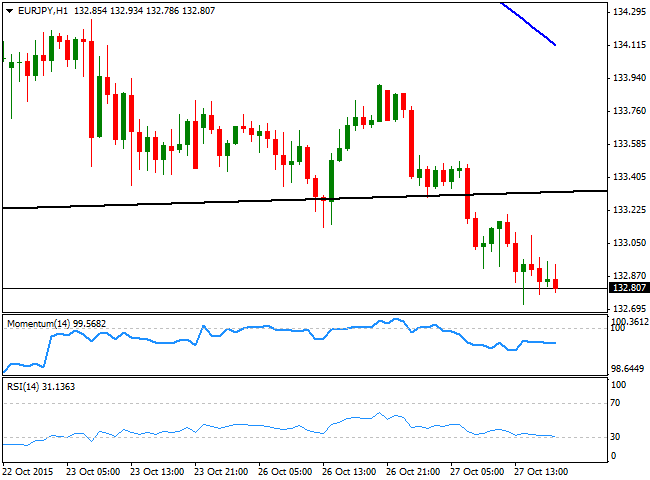
There was no clear catalyst beyond a sudden rally in the yen that led stocks lower, but the Japanese currency appreciated strongly, sending the EUR/JPY pair down to a fresh monthly low of 132.72, standing nearby ahead of a new day start. The pair has broken below the base of the long term symmetrical triangle, which has strong midterm bearish implications, while extended further its decline below its 100 and 200 DMAs. Short term, the bearish momentum eased, but it's still present as the 100 and 200 SMAs accelerated their declines well above the current level, whilst the technical indicators present mild bearish slopes well below their mid-lines. In the 4 hours chart, the Momentum indicator consolidates below the 100 level, lacking clear directional strength, but the RSI indicator heads sharply lower below the 30 level, all of which supports a continued decline.
Support levels: 132.65 132.25 131.70
Resistance levels: 133.30 133.80 134.40
GBP/USD Current price: 1.5296
View Live Chart for the GPB/USD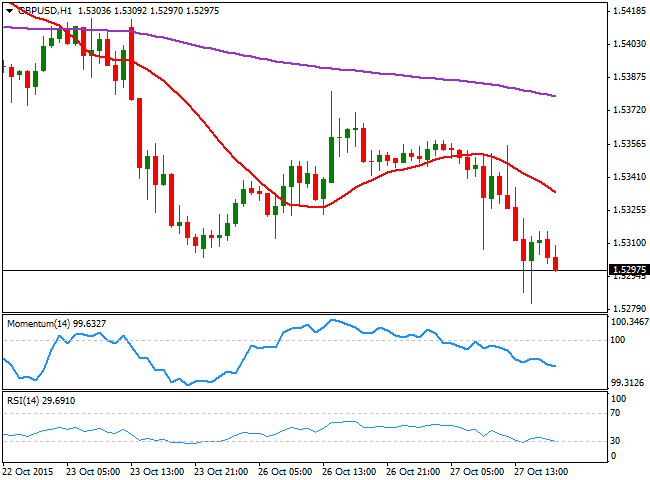
The British Pound came under pressure following the release of the UK third quarter GDP. The UK economy grew 0.5% during the period, leaving the annual rate of growth at 2.3%, and weaker than the 0.6% expectation, mostly weighed by a setback in the construction sector. The GBP/USD pair fell down to 1.5307 after the release, but quickly bounced, meeting short term buying interest and recovering up to 1.5355 before resuming its decline. The pair traded as low as 1.5281, before ending the day around the 1.5300 level. The short term picture is clearly bearish, as in the 1 hour chart, the price has extended well below a bearish 20 SMA, whilst the technical indicators head lower near oversold territory. In the 4 hours chart, the 20 SMA capped the upside for a second day in-a-row, maintaining a strong bearish slope around the mentioned American session high, whilst the technical indicators hold below their mid-lines, and the RSI heads lower near oversold territory, in line with further declines.
Support levels: 1.5280 1.5250 1.5210
Resistance levels: 1.5355 1.5390 1.5420
USD/JPY Current price: 120.32
View Live Chart for the USD/JPY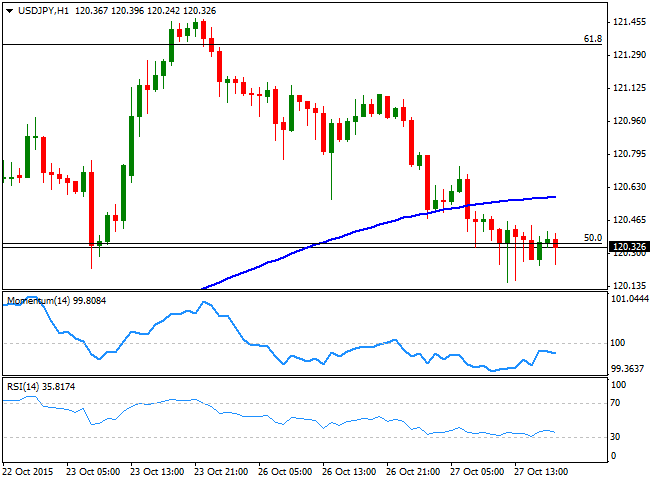
The USD/JPY pair fell at the beginning of the day, as risk aversion dominated the Asian session. There was some speculation that the movement started after some tensions arose as a US navy destroyer entered in the South China Sea. But stocks plunged, and commodities followed, favoring the safe-haven Japanese currency. There was also some speculation that the BOJ will refrain from easing in its Friday meeting, also weighing on the pair, but there was no clear catalyst before the risk-averse move. The rally extended after US data disappointed, and the pair fell down to 120.15 intraday, but bounced back to consolidate around the 120.35 level by the end of the day. The short term picture is now bearish, with the 1 hour chart showing that the price consolidates below its 100 SMA, whilst the technical indicators head south below their mid-lines. In the 4 hours chart, the technical indicators present a strong bearish momentum in negative territory, although the price is still above its 100 and 200 SMAs.
Support levels: 120.00 119.70 119.35
Resistance levels: 120.65 121.00 121.45
AUD/USD Current price: 0.7194
View Live Chart for the AUD/USD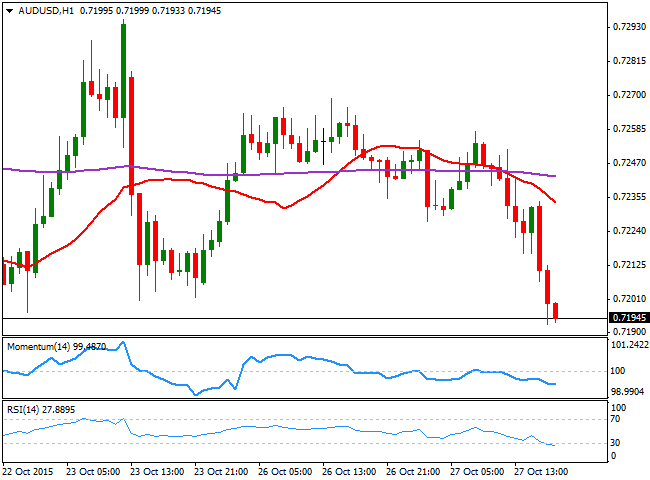
The Aussie fell below the 0.7200 level against its American rival by the end of the day, weighed by the sharp decline in commodities prices, and dollar's demand. Early Wednesday, Australia will release its third quarter inflation figures, with the main reading expected at 0.6% from the previous 0.7%. Also, the RBA will release its annual report, all of which will offer a clearer picture of the economic situation of the country, and therefore lead the currency's moves. Technically, the downside is favored as in the 1 hour chart, the price is well below a strongly bearish 20 SMA whilst the technical indicators head lower, approaching oversold levels. In the 4 hours chart, the price extended below its 20 SMA that anyway lacks directional strength, whilst the Momentum indicator holds flat below the 100 level and the RSI heads lower around 38, increasing the downward risk for the upcoming hours.
Support levels: 0.7190 0.7150 0.7110
Resistance levels: 0.7240 0.7290 0.7335
Information on these pages contains forward-looking statements that involve risks and uncertainties. Markets and instruments profiled on this page are for informational purposes only and should not in any way come across as a recommendation to buy or sell in these assets. You should do your own thorough research before making any investment decisions. FXStreet does not in any way guarantee that this information is free from mistakes, errors, or material misstatements. It also does not guarantee that this information is of a timely nature. Investing in Open Markets involves a great deal of risk, including the loss of all or a portion of your investment, as well as emotional distress. All risks, losses and costs associated with investing, including total loss of principal, are your responsibility. The views and opinions expressed in this article are those of the authors and do not necessarily reflect the official policy or position of FXStreet nor its advertisers. The author will not be held responsible for information that is found at the end of links posted on this page.
If not otherwise explicitly mentioned in the body of the article, at the time of writing, the author has no position in any stock mentioned in this article and no business relationship with any company mentioned. The author has not received compensation for writing this article, other than from FXStreet.
FXStreet and the author do not provide personalized recommendations. The author makes no representations as to the accuracy, completeness, or suitability of this information. FXStreet and the author will not be liable for any errors, omissions or any losses, injuries or damages arising from this information and its display or use. Errors and omissions excepted.
The author and FXStreet are not registered investment advisors and nothing in this article is intended to be investment advice.
Recommended Content
Editors’ Picks

EUR/USD clings to recovery gains above 1.0500 ahead of ECB policy announcements
EUR/USD holds the rebound above 1.0500 in the European session on Thursday amid a broad US Dollar retreat. However, the upside appears capped amid expectations for more ECB rate cuts in 2025. ECB policy announcements and Lagarde's press conference are on tap.

GBP/USD pulls back to 1.2750 as markets turn cautious
GBP/USD is pulling back to near 1.2750 in the European session on Thursday as traders turn cautious. The pair reverses earlier gains even as the US Dollar corrects downwards. The focus remains on the US PPI and Jobless Claims data.

Gold price sits near one-month high on Fed rate cut optimism and softer USD
Gold price seems to have stabilized following good two-way price swings and trades around the $2,720 area during the early European session, just below the highest level in more than a month touched earlier this Thursday.

European Central Bank set to cut interest rates again amid slow economic growth
The European Central Bank is expected to cut benchmark interest rates by 25 bps at the December policy meeting. ECB President Christine Lagarde’s presser will be closely scrutinized for fresh policy cues.

Can markets keep conquering record highs?
Equity markets are charging to new record highs, with the S&P 500 up 28% year-to-date and the NASDAQ Composite crossing the key 20,000 mark, up 34% this year. The rally is underpinned by a potent mix of drivers.

Best Forex Brokers with Low Spreads
VERIFIED Low spreads are crucial for reducing trading costs. Explore top Forex brokers offering competitive spreads and high leverage. Compare options for EUR/USD, GBP/USD, USD/JPY, and Gold.