EUR/USD Current price: 1.1373
View Live Chart for the EUR/USD
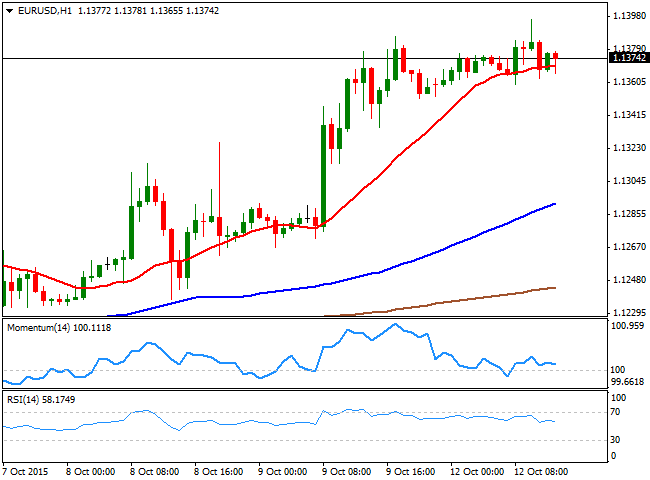
The EUR/USD advanced up to 1.1396 during the European morning, but market's trade in tight ranges this Monday, with no data in Europe and a holiday in the US and Canada that anticipates extreme low volumes for the rest of the day. Dennis Lockhart from the FED is repeating today a speech given on Friday, so it's actually not expected to move the market. Lockhart said in his speech from last week that a rate hike in October or December seems appropriated, but latest FOMC Minutes make it hard for investors to believe in his words. Later today will be the turns from Evans and Lowe, and market will be looking for any clues regarding an upcoming date for a rate hike.
In the meantime the EUR/USD pair 1 hour chart shows that the price is now above a flat 20 SMA, whilst the technical indicators have turned south, now approaching their mid-lines, unable at this point to confirm a bearish continuation. In the 4 hours chart the price holds well above a bullish 20 SMA, whilst the RSI indicator holds around overbought levels, and the Momentum indicator diverges lower, still well above its 100 level. The immediate support comes at 1.1350, and as long as the level holds, the downside seems well limited, with a break above 1.1400 required to confirm additional gains up to 1.1460.
Support levels: 1.1350 1.1320 1.1290
Resistance levels: 1.1400 1.1430 1.1460
GBP/USD Current price: 1.5386
View Live Chart for the GPB/USD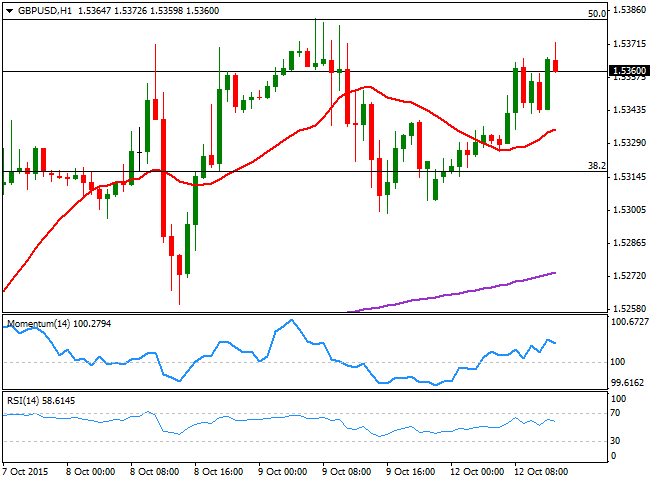
The GBP/USD pair trades with a positive tone this Monday, but below last Friday's high of 1.5382, also the 61.8% retracement on its latest daily decline. The pair has a limited upward potential in the short term, mostly due to the lack of volume rather than anything else. The 1 hour chart shows that the price holds above a mild bullish 20 SMA, but that the technical indicators have turned lower in positive territory, suggesting not enough upward momentum to confirm a break higher at the time being. In the 4 hours chart, the price is firmly above a bullish 20 SMA, whilst the RSI indicator aims higher around 62. The Momentum indicator in this last time frame however, has lost its upward strength and stands flat around 100, in line with the shorter term view.
Support levels: 1.5300 1.5260 1.5220
Resistance levels: 1.5385 1.5430 1.5470
USD/JPY Current price: 120.10
View Live Chart for the USD/JPY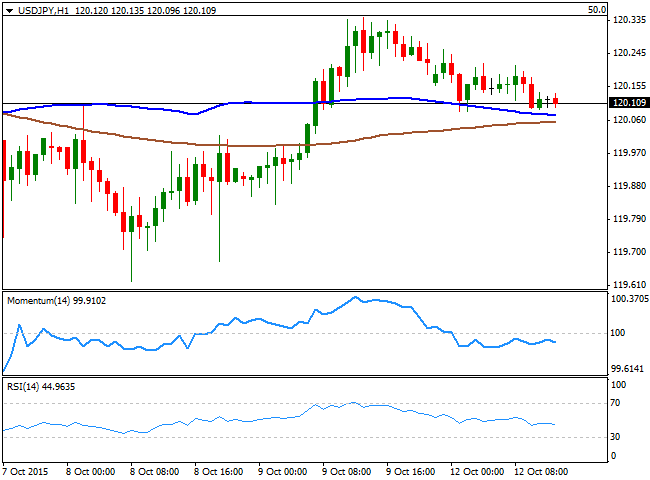
Still lifeless around 120.00 The USD/JPY pair has been under very limited pressure this Monday, trading near its daily low but unchanged daily basis. A strong advance in Asian share markets was not enough to boost the pair during the first half of the day, and is unlikely some action will take place until next Tuesday's Asian opening, given that is a bank holiday in the US. Technically, there has been no additional progress, with the pair still glued to the 120.00 region, although the short term picture is slightly negative, given that the price is holding a few pips above its 100 and 200 SMAs, whilst the technical indicators have turned south right below their mid-lines. In the 4 hours chart, the price continues moving back and forth around its 100 and 200 SMAs that anyway remain flat, whilst the technical indicators have turned slightly lower around their mid-lines.
Support levels: 120.00 119.60 119.35
Resistance levels: 120.35 120.70 121.00
AUD/USD Current price: 0.7371
View Live Chart for the AUD/USD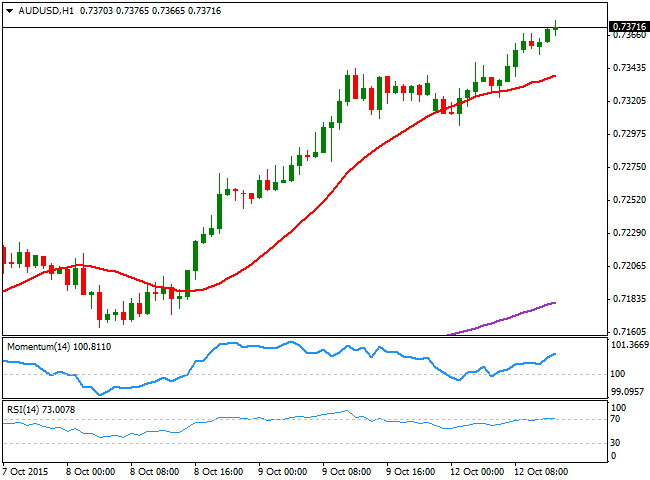
The AUD/USD pair trades at a fresh 2-month high, boosted by gold prices, as spot extended its advance up to $1,168.04 a troy ounce. Trading a couple of pips below the daily high set at 0.7376, the pair maintains the strong upward momentum seen on previous updates. Technically, the 1 hour chart shows that the price is still above a bullish 20 SMA, whilst the technical indicators maintain their bullish slopes around overbought levels. In the 4 hours chart, the Momentum indicator is beginning to look exhausted towards the upside, although the RSI indicator maintains a strong bullish slope, despite being at 78, whilst the 20 SMA maintains a sharp upward tone well below the current level, supporting a continued advance towards the 0.7400 figure.
Support levels: 0.7350 0.7310 0.7275
Resistance levels: 0.7400 0.7440 0.7485
Information on these pages contains forward-looking statements that involve risks and uncertainties. Markets and instruments profiled on this page are for informational purposes only and should not in any way come across as a recommendation to buy or sell in these assets. You should do your own thorough research before making any investment decisions. FXStreet does not in any way guarantee that this information is free from mistakes, errors, or material misstatements. It also does not guarantee that this information is of a timely nature. Investing in Open Markets involves a great deal of risk, including the loss of all or a portion of your investment, as well as emotional distress. All risks, losses and costs associated with investing, including total loss of principal, are your responsibility. The views and opinions expressed in this article are those of the authors and do not necessarily reflect the official policy or position of FXStreet nor its advertisers. The author will not be held responsible for information that is found at the end of links posted on this page.
If not otherwise explicitly mentioned in the body of the article, at the time of writing, the author has no position in any stock mentioned in this article and no business relationship with any company mentioned. The author has not received compensation for writing this article, other than from FXStreet.
FXStreet and the author do not provide personalized recommendations. The author makes no representations as to the accuracy, completeness, or suitability of this information. FXStreet and the author will not be liable for any errors, omissions or any losses, injuries or damages arising from this information and its display or use. Errors and omissions excepted.
The author and FXStreet are not registered investment advisors and nothing in this article is intended to be investment advice.
Recommended Content
Editors’ Picks

EUR/USD drops below 1.0550 ahead of German inflation data
EUR/USD extends losses below 1.0550 in the European session on Thursday. The pair's downside could be attributed to French political worries and a broad US Dollar rebound amid the cautious mood. Traders remain wary due to mounting trade war risks. Germany's inflation data is in focus.

GBP/USD holds lower ground near 1.2650
GBP/USD remains pressured near 1.2600 in European trading on Thursday as the US Dollar picks up haven dmeand on deteriorating risk sentiment. A sense of cautiom prevails amid Trump's tariff plans even though liquidity remains thin on Thanksgiving Day.

Gold price bulls remain on the sidelines on stronger USD, positive risk tone
Gold price (XAU/USD) reverses an intraday dip to the $2,620 area and trades near the daily high during the first half of the European session on Thursday, albeit it lacks bullish conviction. Investors remain concerned that US President-elect Donald Trump's tariff plans will impact the global economic outlook.

Fantom bulls eye yearly high as BTC rebounds
Fantom (FTM) continued its rally and rallied 8% until Thursday, trading above $1.09 after 43% gains in the previous week. Like FTM, most altcoins have continued the rally as Bitcoin (BTC) recovers from its recent pullback this week.

Eurozone PMI sounds the alarm about growth once more
The composite PMI dropped from 50 to 48.1, once more stressing growth concerns for the eurozone. Hard data has actually come in better than expected recently – so ahead of the December meeting, the ECB has to figure out whether this is the PMI crying wolf or whether it should take this signal seriously. We think it’s the latter.

Best Forex Brokers with Low Spreads
VERIFIED Low spreads are crucial for reducing trading costs. Explore top Forex brokers offering competitive spreads and high leverage. Compare options for EUR/USD, GBP/USD, USD/JPY, and Gold.