EUR/USD Current price: 1.1356
View Live Chart for the EUR/USD

The American dollar closed the week broadly lower against most of its majors rivals, in a week characterized by dovish Central Banks. Both, the ECB and the FED in the minutes of their latest meetings, expressed their concerns over the global economic inflation, and the low inflation levels. The US Central Bank, said that the labor market had "improved considerably," but the meeting was held way before the latest disappointing US Nonfarm Payroll report. During the upcoming days, most of the major economies will release its September inflation readings, which may determinate if the ongoing dollar's weakness is set to extend.
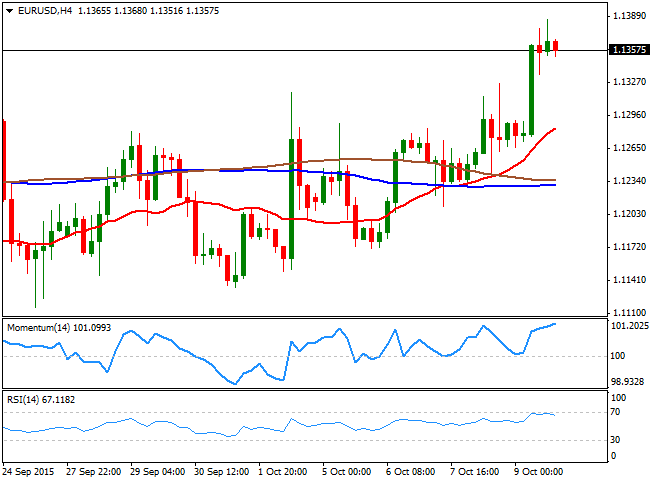
In the meantime, the EUR/USD pair rose up to 1.1386 last Friday, ending at its highest in 6 weeks, at 1.1357 and maintaining a positive tone. However, and from a technical point of view, the pair is not yet able to confirm a bullish continuation, given that the top of these last few months' range stands at 1.1460, disregarding the Black Monday spike up to 1.1713. With the pair trading 100 pips below the critical resistance, the daily chart shows that, despite the price is above its moving averages, the indicators lack directional strength and remain horizontal. In the same chart, the RSI indicator presents a bullish slope around 60, whilst the Momentum indicator has lost its upward strength, but holds above its mid-line, all of which supports additional gains for this Monday. In the 4 hours chart, the 20 SMA maintains a bullish slope well below the current level, whilst the technical indicators have lost their upward strength, but hold near overbought levels. The pair needs now to advance beyond 1.1426, to test the critical resistance area around 1.1460, with a break above it, confirming a bullish continuation during the upcoming sessions.
Support levels: 1.1335 1.1295 1.1260
Resistance levels: 1.1425 1.1460 1.1500
EUR/JPY Current price: 136.54
View Live Chart for the EUR/JPY
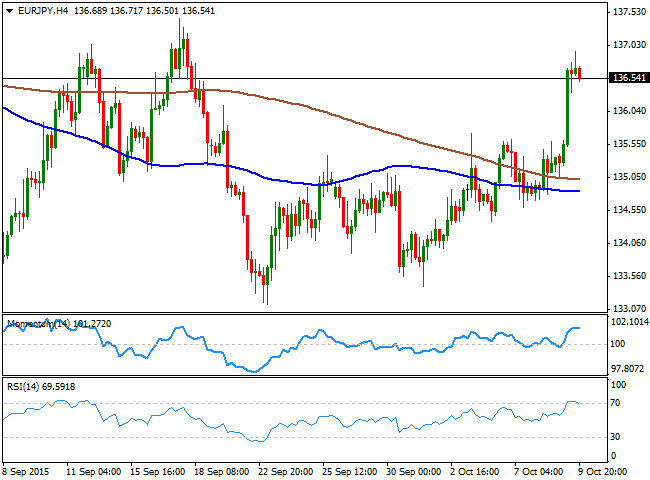
The EUR/JPY edged higher on Friday and flirted with the 137.00 level before closing the week at 136.54, and above its 100 DMA for the first time since mid September. The pair however, lacks a clear directional strength, pretty much since last May, and the range keeps shrinking as the price approaches the vortex of a huge triangle, clear in the daily chart. In it, the technical indicators stand well above their mid-lines, albeit the Momentum has partially lost its upward strength, whilst the 200 DMA offers a strong dynamic support in the 134.40 price zone. Shorter term, the 4 hours chart shows that the price is well above its moving averages that anyway maintain their tepid bearish slopes, whilst the technical indicators are beginning to look exhausted in overbought territory, supporting a bearish correction on a break below 136.30, the immediate support. The daily descendant trend line that comes from June high at 140.99, stands these days around 137.70, also a strong static resistance level, and it will likely attract selling interest if reached this Monday.
Support levels: 136.30 135.70 135.30
Resistance levels: 136.95 137.20 137.70
GBP/USD Current price: 1.5341
View Live Chart for the GPB/USD
Pound's weekly rally was interrupted last Friday, following the release of the UK trade balance data. The GBP/USD pair rose up to 1.5382, finding a strong resistance at the 50% retracement of its latest daily decline between 1.5657 and 1.5196. After a short period of consolidation, the pair retreated down to 1.5299, but managed to close the week with solid gains around 1.5320. During this week, the UK will release its employment and inflation figures for September, and readings above expected should lead to another leg higher in the pair, with the market no targeting 1.5445, the 61.8% retracement of the mentioned rally. Daily basis, the price has managed to hold above its 20 SMA, but the moving average maintains a strong bearish slope. The technical indicators in the same time frame, have lost their upward strength right after crossing their mid-lines, which at this point, limits chances of a stronger rally. In the 4 hours chart the price is struggling to overcome its 200 EMA, whilst the 20 SMA maintains a strong bullish slope a handful of pips below the current level, and the technical indicators head lower around their mid-lines, increasing chances of a downward move on a break below 1.5300.
Support levels: 1.53005 1.5260 1.5220
Resistance levels: 1.5340 1.5385 1.5430
USD/JPY Current price: 120.21
View Live Chart for the USD/JPY
The USD/JPY pair has extended its limited range for one more week, still glued to 120.00 price zone, and with no aims to break it according in the nearer term. By the ends of October, the FED and the BOJ will have economic policy meetings, in which the last will review its forecast and economic conditions, and there's some speculation pointing for an extension of Japanese monetary stimulus by then. But in the meantime, the range set late August between 118.65 and 121.35 will likely prevail. Technically, the daily chart shows that the price has continued developing well below the 200 DMA that converges with the main resistance and top of the range a 121.35, whilst the 100 DMA extended its decline above this last. In the same chart, the technical indicators are still lacking directional strength around their mid-lines, maintaining the neutral stance. In the short term the 4 hours chart shows that the price is around its moving averages, whist the technical indicators are also neutral, with a tepid bearish slope right above their mid-lines.
Support levels: 119.60 119.35 118.90
Resistance levels: 120.35 120.70 121.00
AUD/USD Current price: 0.7332
View Live Chart for the AUD/USD
The AUD/USD pair has closed at its highest since late August, closing its ninth day in-a-row with gains last Friday at 0.7332. The strong recovery in the Aussie was supported by commodities' recovery, as particularly oil and gold seem to have set interim bottoms, and rose to multi-month highs on hopes the FED will remain on hold until 2016. The risk of a downward corrective in the AUD/USD pair has increased exponentially, and there's a good chance the pair may correct lower during this week, particularly if Australian employment data disappoint. Also, China will release its inflation figures for September these days, which if negative, may hit the Aussie as the risk of slowing economic conditions in the region remain intact. Technically, however, the daily chart maintains a strong upward momentum, given that the technical indicators continue heading sharply higher, despite entering overbought territory. The 20 SMA in the mentioned time frame, has gained a tepid bullish slope around 0.7100, not actually significant at the time being. In the 4 hours chart, the technical indicators are barely losing strength in extreme overbought territory, whilst the 20 SMA accelerated its advance below the current price and stands now around 0.7240. The pair can correct down to 0.7110 without really losing its longer term upward potential, yet a break below this last should open doors for additional decline, back below the 0.7000 figure.
Support levels: 0.7310 0.7275 0.7240
Resistance levels: 0.7365 0.7400 0.7440
Information on these pages contains forward-looking statements that involve risks and uncertainties. Markets and instruments profiled on this page are for informational purposes only and should not in any way come across as a recommendation to buy or sell in these assets. You should do your own thorough research before making any investment decisions. FXStreet does not in any way guarantee that this information is free from mistakes, errors, or material misstatements. It also does not guarantee that this information is of a timely nature. Investing in Open Markets involves a great deal of risk, including the loss of all or a portion of your investment, as well as emotional distress. All risks, losses and costs associated with investing, including total loss of principal, are your responsibility. The views and opinions expressed in this article are those of the authors and do not necessarily reflect the official policy or position of FXStreet nor its advertisers. The author will not be held responsible for information that is found at the end of links posted on this page.
If not otherwise explicitly mentioned in the body of the article, at the time of writing, the author has no position in any stock mentioned in this article and no business relationship with any company mentioned. The author has not received compensation for writing this article, other than from FXStreet.
FXStreet and the author do not provide personalized recommendations. The author makes no representations as to the accuracy, completeness, or suitability of this information. FXStreet and the author will not be liable for any errors, omissions or any losses, injuries or damages arising from this information and its display or use. Errors and omissions excepted.
The author and FXStreet are not registered investment advisors and nothing in this article is intended to be investment advice.
Recommended Content
Editors’ Picks

EUR/USD stays near 1.0400 in thin holiday trading
EUR/USD trades with mild losses near 1.0400 on Tuesday. The expectation that the US Federal Reserve will deliver fewer rate cuts in 2025 provides some support for the US Dollar. Trading volumes are likely to remain low heading into the Christmas break.

GBP/USD struggles to find direction, holds steady near 1.2550
GBP/USD consolidates in a range at around 1.2550 on Tuesday after closing in negative territory on Monday. The US Dollar preserves its strength and makes it difficult for the pair to gain traction as trading conditions thin out on Christmas Eve.

Gold holds above $2,600, bulls non-committed on hawkish Fed outlook
Gold trades in a narrow channel above $2,600 on Tuesday, albeit lacking strong follow-through buying. Geopolitical tensions and trade war fears lend support to the safe-haven XAU/USD, while the Fed’s hawkish shift acts as a tailwind for the USD and caps the precious metal.

IRS says crypto staking should be taxed in response to lawsuit
In a filing on Monday, the US International Revenue Service stated that the rewards gotten from staking cryptocurrencies should be taxed, responding to a lawsuit from couple Joshua and Jessica Jarrett.

2025 outlook: What is next for developed economies and currencies?
As the door closes in 2024, and while the year feels like it has passed in the blink of an eye, a lot has happened. If I had to summarise it all in four words, it would be: ‘a year of surprises’.

Best Forex Brokers with Low Spreads
VERIFIED Low spreads are crucial for reducing trading costs. Explore top Forex brokers offering competitive spreads and high leverage. Compare options for EUR/USD, GBP/USD, USD/JPY, and Gold.