EUR/USD Current price: 1.1259
View Live Chart for the EUR/USD
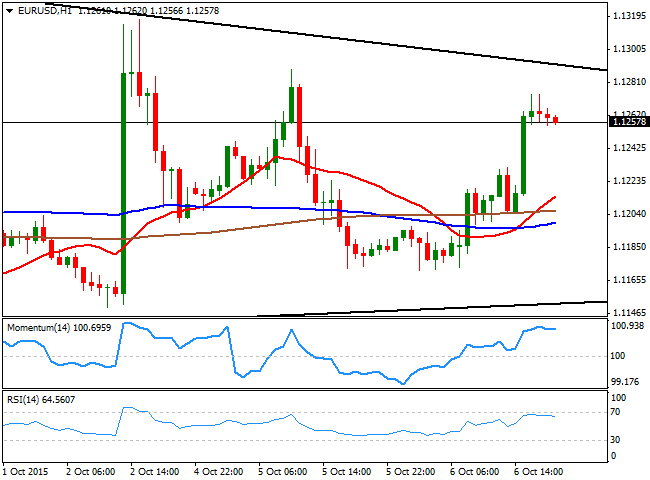
The American dollar took a dive early in the US session, as commodities extended their latest advances, with gold approaching $1,150 a troy ounce and WTI surging above $47.0 a barrel. US indexes also opened broadly higher, but gave up most of its intraday gains ahead of the close. The EUR/USD pair traded in quite a limited range during the first half of the day, hovering around the 1.1200 and lacking directional strength, as no clues came from European stocks, which traded range bound during the European morning. The macroeconomic calendar was light, with Germany factory orders, down 1.8% in August compared to July, and the US trade balance deficit that widened to $48.3B in the same month, the largest expansion in US deficit in five months. The news boosted local share markets as sagging exports should put additional pressure on a FED's possible rate hike.
The EUR/USD pair surged to a daily high of 1.1274, trading within Monday's range and still confined in a daily triangle. Short term, the upward momentum is fading in the 1 hour chart, as despite the price is well above its moving averages, the technical indicators are beginning to show signs of exhaustion near overbought territory. In the 4 hours chart, the 20 SMA is now aiming higher around 1.1200, whilst the Momentum indicator turned south and is crossing now below its 100 level, whilst the RSI indicator stands flat around 58, all of which limits chances of additional gains, during the upcoming hours. Additionally, the price is getting too close to the vortex of the figure, and it will be invalidate if it's not broken during the next couple of days. For this Wednesday, the roof of the figure is set at 1.1285, whilst the base stands now at 1.1160.
Support levels: 1.1245 1.1200 1.1160
Resistance levels: 1.1285 1.1335 1.1370
EUR/JPY Current price: 135.57
View Live Chart for the EUR/JPY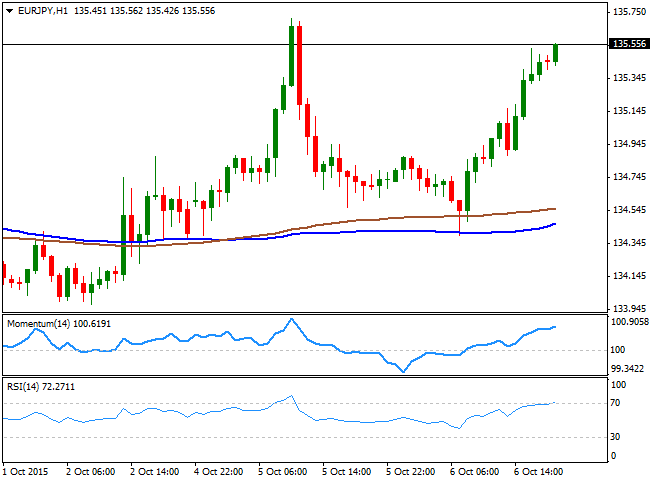
The EUR/JPY pair advanced over 100 pips this Tuesday, establishing fresh daily highs ahead of the US close in the 135.50/60 price zone, on broad EUR demand and a neutral JPY. Ahead of the Bank of Japan economic policy meeting, later in the Asian session, the hour chart shows that the pair surged sharply after bottoming around its 100 SMA, and that the technical indicators head higher in overbought levels. In the 4 hours chart, the price is above its 100 and 200 SMAs for the first time since mid September, while the technical indicators are losing their upward strength, but hold well above their mid-lines. Additional gains beyond 135.70, this month high, should lead to a continued advance towards the 137.00 price zone.
Support levels: 135.10 134.60 134.20
Resistance levels: 135.70 136.20 136.70
GBP/USD Current price: 1.5230
View Live Chart for the GPB/USD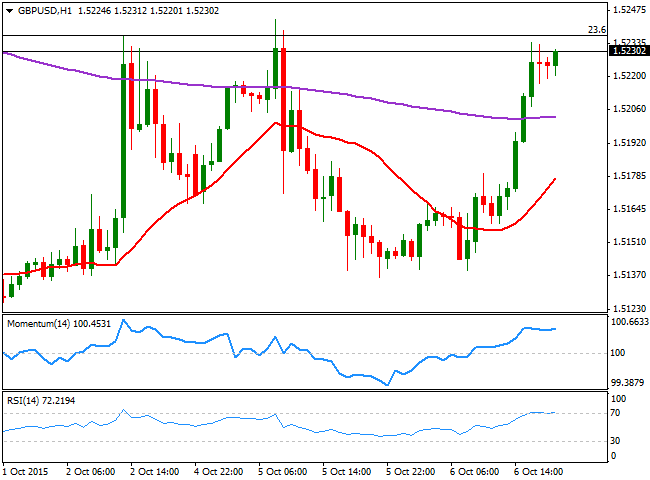
The British Pound advanced towards a critical resistance against its American rival, with the pair trading a handful of pips below the 23.6% retracement of its latest bearish run around 1.5240 by the US close. In the UK, the Halifax house prices indexes showed that during the third quarter of 2015, prices surged by 2.0% compared to the previous quarter, and 8.6% compared to a year before. The numbers were below market's expectations, but continue to suggest a bubble is surging in the housing sector, as the increasing demand of new houses is the result of interest rates holding near zero in the UK. Fears are that, once the BOE decides to tighten its economic policy, the housing market will collapse, leading to a new crisis. In the meantime, the short term technical picture is bullish, as the 1 hour chart shows that the 20 SMA heads strongly higher below the current level, whilst the technical indicators are aiming higher after consolidating in overbought territory. In the 4 hours chart the price is also above a mild bullish 20 SMA, but the technical indicators lack upward momentum, hovering however, in positive territory. The pair needs to accelerate above the 1.5245 level to be able to extend its advance, towards the 1.5320 price zone, the 38.2% retracement of the same decline.
Support levels: 1.5130 1.5100 1.5060
Resistance levels: 1.5245 1.5270 1.5320
USD/JPY Current price: 120.29
View Live Chart for the USD/JPY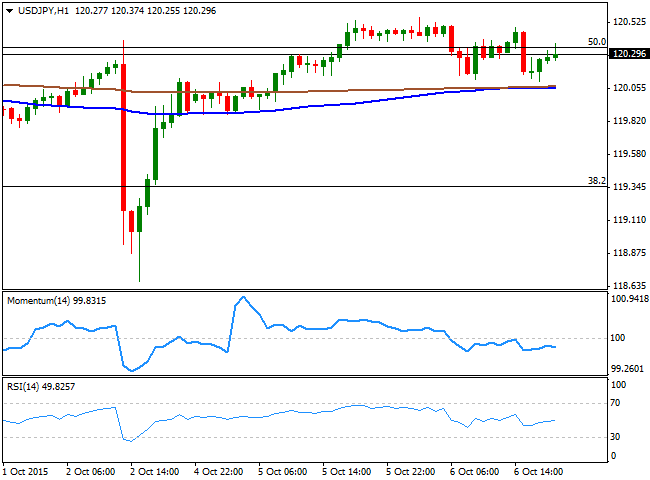
The USD/JPY pair traded uneventfully around the 120.35 Fibonacci level for most of this Tuesday, as investors can´t find a trigger strong enough to take the pair out of its latest range. The BOJ will release the result of its latest economic policy meeting during the upcoming hours, but market's expectations are that the Central Bank is likely to maintain the current pace of monetary easing unchanged, mostly because its due to revise its economic and inflation forecasts and have another economic policy meeting by the end of this month. In the meantime, the pair presents a mild bearish tone in the short term, as the 1 hour chart shows that the 100 and 200 SMAs converge around 120.05, whilst the technical indicators head lower below their mid-lines. In the 4 hours chart, the price is a few pips above its 100 and 200 SMAs, with the largest presenting a sharp bearish slope, whilst the technical indicators head higher after bouncing from their mid-lines, supporting additional advances, although only above 120.70 the pair will be able to extend its gains this Wednesday.
Support levels: 120.05 119.60 119.35
Resistance levels: 120.70 121.00 121.35
AUD/USD Current price: 0.7153
View Live Chart for the AUD/USD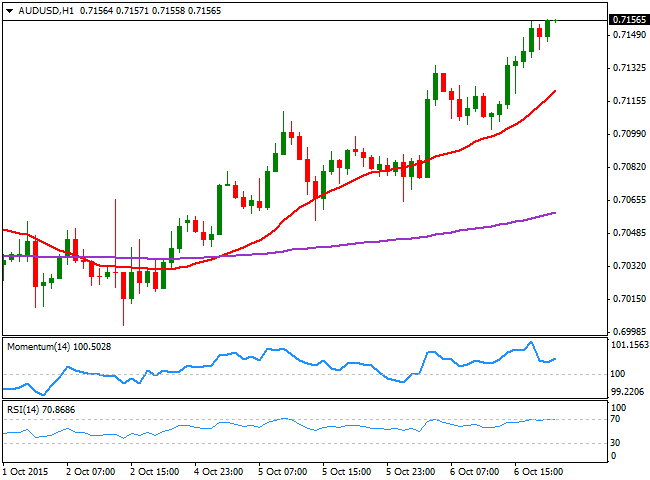
The AUD/USD pair trades at its highest in 2 weeks, boosted by a less dovish than-expected RBA statement at the beginning of the day, and a continued recovery in commodity prices. The Central Bank Governor, Glenn Stevens, showed little concern over the economic slowdown in the region, and even cited improvement in the labor market after leaving rates unchanged at 2.0%. The pair holds near its highs early Asia and the 1 hour chart shows that the Momentum indicator has resumed its advance well above its 100 level after correcting overbought readings, whilst the RSI indicator holds around 70, and the 20 SMA heads sharply higher around 0.7120. In the 4 hours chart the technical indicators have lost upward their strength near overbought levels, but the price has broken above its 200 EMA for the first time since mid September, supporting additional gains in the mid-term, as long as the level holds.
Support levels: 0.7115 0.7170 0.7130
Resistance levels: 0.7180 0.7230 0.7280
Information on these pages contains forward-looking statements that involve risks and uncertainties. Markets and instruments profiled on this page are for informational purposes only and should not in any way come across as a recommendation to buy or sell in these assets. You should do your own thorough research before making any investment decisions. FXStreet does not in any way guarantee that this information is free from mistakes, errors, or material misstatements. It also does not guarantee that this information is of a timely nature. Investing in Open Markets involves a great deal of risk, including the loss of all or a portion of your investment, as well as emotional distress. All risks, losses and costs associated with investing, including total loss of principal, are your responsibility. The views and opinions expressed in this article are those of the authors and do not necessarily reflect the official policy or position of FXStreet nor its advertisers. The author will not be held responsible for information that is found at the end of links posted on this page.
If not otherwise explicitly mentioned in the body of the article, at the time of writing, the author has no position in any stock mentioned in this article and no business relationship with any company mentioned. The author has not received compensation for writing this article, other than from FXStreet.
FXStreet and the author do not provide personalized recommendations. The author makes no representations as to the accuracy, completeness, or suitability of this information. FXStreet and the author will not be liable for any errors, omissions or any losses, injuries or damages arising from this information and its display or use. Errors and omissions excepted.
The author and FXStreet are not registered investment advisors and nothing in this article is intended to be investment advice.
Recommended Content
Editors’ Picks

EUR/USD falls to fresh daily lows below 1.0400 after upbeat US data
EUR/USD came under selling pressure early in the American session following the release of United States macroeconomic figures. The December ISM Services PMI unexpectedly surged to 54.1, while November JOLTS Job Openings rose to 8.1 million, also bearing expectations.

GBP/USD extends retracement, struggles to retain 1.2500
GBP/USD lost further traction and battles to retain the 1.2500 mark after hitting an intraday high of 1.2575. Stock markets turned south after the release of upbeat American data, providing fresh legs to the US Dollar rally.

Gold holds on to modest gains amid a souring mood
Spot Gold lost its bullish traction and retreated toward the $2,650 area following the release of encouraging US macroeconomic figures. Jumping US Treasury yields further support the US Dollar in the near term.

Bitcoin Price Forecast: BTC holds above $100K following Fed’s Michael Barr resign
Bitcoin edges slightly down to around $101,300 on Tuesday after rallying almost 4% the previous day. The announcement of Michael S. Barr’s resignation as Federal Reserve Vice Chair for Supervision on Monday has pushed BTC above the $100K mark.
Five fundamentals for the week: Nonfarm Payrolls to keep traders on edge in first full week of 2025 Premium
Did the US economy enjoy a strong finish to 2024? That is the question in the first full week of trading in 2025. The all-important NFP stand out, but a look at the Federal Reserve and the Chinese economy is also of interest.

Best Forex Brokers with Low Spreads
VERIFIED Low spreads are crucial for reducing trading costs. Explore top Forex brokers offering competitive spreads and high leverage. Compare options for EUR/USD, GBP/USD, USD/JPY, and Gold.