EUR/USD Current price: 1.1194
View Live Chart for the EUR/USD

Investors continued trading on sentiment this Thursday, and stocks led the way for FX traders. At the beginning of the day, Chinese manufacturing data for September were largely steady from the previous month, as the government's official gauge of manufacturing activity improved to 49.8 from August 47.9, while the Markit PMI fell to a fresh over six years low of 47.2 from a previous 47.3, although above previous estimate of 47. Asian share markets closed in the green, sending the EUR/USD pair down to 1.1134. In Europe, the release of the local PMIs showed also a soft picture, with the German manufacturing PMI for September falling down to 52.3 from previous 52.5, while the French reading held above the 50.0 level. The region final reading came as expected at 52. European stocks halted their initial rally after the news, favoring a recovery in the common currency, and extended their declines after Wall Street opening, as US data released through the session was quite poor, with the weekly unemployment claims rising to 277K and the ISM manufacturing PMI falling down to 50.2 from previous 51.1.
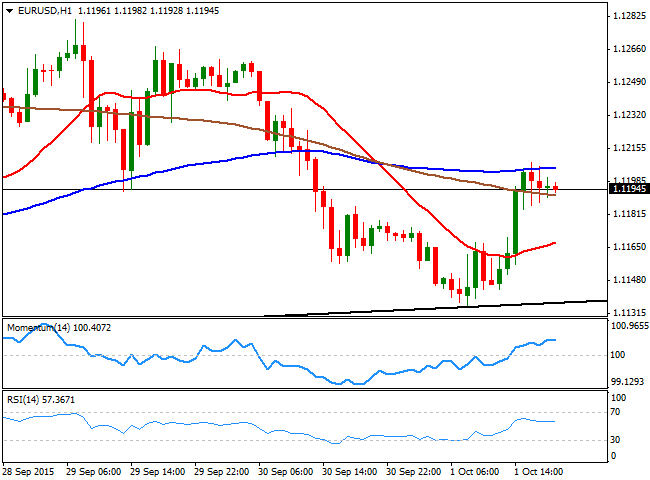
The EUR/USD pair advanced up to 1.1206 before pulling back some, consolidating nearby by the end of the day, as investors entered in wait-and-see mode ahead of the release of US employment data early Friday. The Nonfarm Payroll report for September is expected to show that the country added a bit above 200K new jobs in the month, whilst the unemployment rate is expected to hold steady at 5.1%. Technically, the 1 hour chart shows that the price retreated from its 100 SMA, but remains well above a bullish 20 SMA, currently around 1.1160, whilst the technical indicators are losing their upward strength, retreating from near overbought readings. In the 4 hours chart, the pair topped around a flat 20 SMA whilst the technical indicators remain flat below their mid-lines, lacking directional strength. Upcoming moves will depend purely on the result of the US employment data, although seems unlikely that the report will be enough to set a clear directional move for the upcoming sessions.
Support levels: 1.1160 1.1120 1.1080
Resistance levels: 1.1220 1.1250 1.1290
EUR/JPY Current price: 134.13
View Live Chart for the EUR/JPY
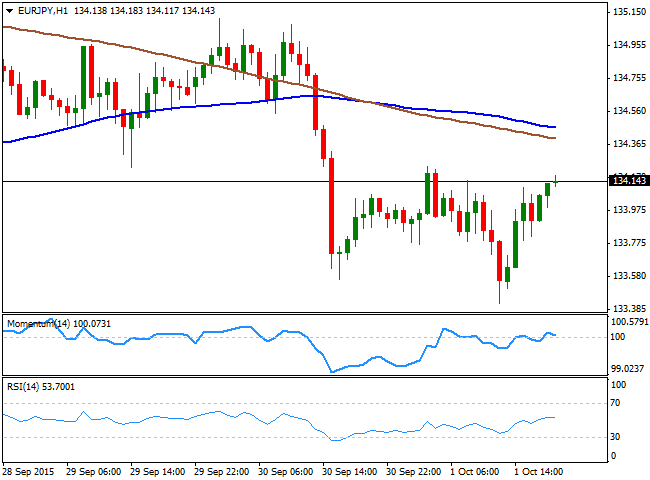
The EUR/JPY pair managed to recover above the 134.00 level after trading as low as 133.42, level reached early in the European session, as the decline in stocks resulted in some intraday JPY gains. The common currency recovery however, alongside with US stocks bouncing from their lows before the closing bell, resulted in the latest recovery in the pair that anyway is not enough to confirm additional gains, as the daily chart shows that the pair has set a lower low and a lower high, whilst the technical indicators remain in negative territory. For the upcoming hours, the 1 hour chart shows that the price remains well below its 100 and 200 SMAs, both heading lower in the 134.30/40 region and maintaining the risk towards, the downside, whilst the technical indicators are turning south around their mid-lines, far from signaling a continued upward momentum. In the 4 hours chart, the price is well below its moving averages, whilst the technical indicators turned flat in negative territory, giving no clues on what's next for the pair.
Support levels: 133.65 133.30 132.90
Resistance levels: 134.25 134.60 135.10
GBP/USD Current price: 1.5133
View Live Chart for the GPB/USD
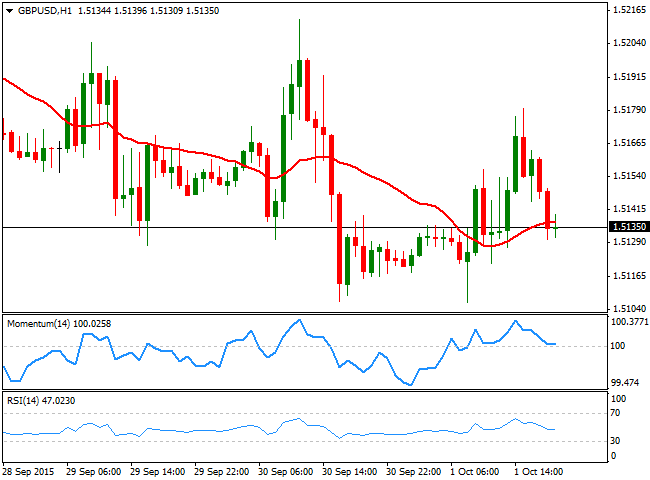
The British Pound remains under pressure, having extended its decline down to 1.5106 against the greenback, before managing to bounce back some. In the UK, the September Markit manufacturing PMI resulted better-than-expected, printing 51.5 against market's forecast of 51.3. The number however, is the lowest in 3 months, slightly below August reading of 51.6. Dollar's broad weakness during the American afternoon triggered a short lived rally, with the pair advancing to a daily high of 1.5179 before retreating. Closing the day barely in the green, the pair maintains a neutral-to-bearish technical stance, despite it has been falling steadily for over two weeks and the movement seems overdone. In the 1 hour chart, the price is now around its 20 SMA, whilst the technical indicators are once again around their mid-lines, giving no clear directional clues. In the 4 hours chart, the pair is still unable to clearly bearish above a bearish 20 SMA, whilst the technical indicators present tepid bearish slopes after failing to advance beyond their mid-lines.
Support levels: 1.5120 1.5090 1.5060
Resistance levels: 1.5160 1.5200 1.5245
USD/JPY Current price: 119.87
View Live Chart for the USD/JPY
After quite a choppy trading day, the USD/JPY pair ends pretty much where it started a few pips below the 120.00 level, having extended its September´s range at the beginning of this month. In Japan, the Tankan survey was mixed, as business sentiment fell for the first time this year among large manufacturers down to 12 while non-manufacturers sentiment inched higher to 19. The 1 hour chart shows that the 100 SMA is gaining bearish strength above the current level, whilst the technical indicators have corrected their oversold readings, but remain in negative territory, increasing the risk of another leg lower. In the 4 hours chart, the technical picture remains neutral as on previous updates, with the price contained between Fibonacci levels and below its 100 and 200 SMAs, the Momentum indicator stuck around its 100 level, and the RSI hovering in negative territory, currently around 48. The pair may finally break its range with the US Nonfarm Payroll release, but the reading has to be a huge surprise, either positive or negative, to be able to take the pair out it.
Support levels: 119.60 119.35 119.00
Resistance levels: 120.00 120.35 120.70
AUD/USD Current price: 0.7030
View Live Chart for the AUD/USD
The Aussie advanced for a third day in-a-row against the greenback, with the pair having reached a daily high of 0.7083 before retreating to the current 0.7030 region. The pair rallied on the back of an improved sentiment at the beginning of the day that sent stocks higher in Asia, but the rally faded alongside with stocks afterwards. Technically, and despite the pair holds above the 0.7000 level, the risk has turned back towards the downside, as the 1 hour chart shows that the price is well below a still bullish 20 SMA, whilst the technical indicators are losing bearish momentum, but remain well below their mid-lines. In the 4 hours chart, the technical indicators have turned sharply lower from near overbought territory, and are getting closer to cross their mid-lines towards the downside, whilst the 20 SMA remains horizontal around 0.7000, providing an immediate short term support.
Support levels: 0.7000 0.6955 0.6930
Resistance levels: 0.7050 0.7080 0.7110
Information on these pages contains forward-looking statements that involve risks and uncertainties. Markets and instruments profiled on this page are for informational purposes only and should not in any way come across as a recommendation to buy or sell in these assets. You should do your own thorough research before making any investment decisions. FXStreet does not in any way guarantee that this information is free from mistakes, errors, or material misstatements. It also does not guarantee that this information is of a timely nature. Investing in Open Markets involves a great deal of risk, including the loss of all or a portion of your investment, as well as emotional distress. All risks, losses and costs associated with investing, including total loss of principal, are your responsibility. The views and opinions expressed in this article are those of the authors and do not necessarily reflect the official policy or position of FXStreet nor its advertisers. The author will not be held responsible for information that is found at the end of links posted on this page.
If not otherwise explicitly mentioned in the body of the article, at the time of writing, the author has no position in any stock mentioned in this article and no business relationship with any company mentioned. The author has not received compensation for writing this article, other than from FXStreet.
FXStreet and the author do not provide personalized recommendations. The author makes no representations as to the accuracy, completeness, or suitability of this information. FXStreet and the author will not be liable for any errors, omissions or any losses, injuries or damages arising from this information and its display or use. Errors and omissions excepted.
The author and FXStreet are not registered investment advisors and nothing in this article is intended to be investment advice.
Recommended Content
Editors’ Picks

EUR/USD keeps the red near 1.0550 ahead of German inflation data
EUR/USD holds losses near 1.0550 in the European morning on Thursday. The pair's downside could be attributed to French political worries and a broad US Dollar rebound amid the cautious mood. Traders remain wary due to mounting trade war risks. Germany's inflation data is in focus.

GBP/USD holds lower ground near 1.2650
GBP/USD remains pressured near 1.2600 in European trading on Thursday as the US Dollar picks up haven dmeand on deteriorating risk sentiment. A sense of cautiom prevails amid Trump's tariff plans even though liquidity remains thin on Thanksgiving Day.

Gold price stays defensive below $2,640 amid reviving US Dollar demand
Gold price reverts toward the weekly low of $2,605 in the early European session on Thanksgiving Thursday, snapping a two-day recovery. The US Dollar (USD) and the US Treasury bond yields breathe a sigh of relief, exerting downward pressure on the Gold price amid holiday-thinned trading conditions.

Fantom bulls eye yearly high as BTC rebounds
Fantom (FTM) continued its rally and rallied 8% until Thursday, trading above $1.09 after 43% gains in the previous week. Like FTM, most altcoins have continued the rally as Bitcoin (BTC) recovers from its recent pullback this week.

Eurozone PMI sounds the alarm about growth once more
The composite PMI dropped from 50 to 48.1, once more stressing growth concerns for the eurozone. Hard data has actually come in better than expected recently – so ahead of the December meeting, the ECB has to figure out whether this is the PMI crying wolf or whether it should take this signal seriously. We think it’s the latter.

Best Forex Brokers with Low Spreads
VERIFIED Low spreads are crucial for reducing trading costs. Explore top Forex brokers offering competitive spreads and high leverage. Compare options for EUR/USD, GBP/USD, USD/JPY, and Gold.