EUR/USD Current price: 1.1245
View Live Chart for the EUR/USD
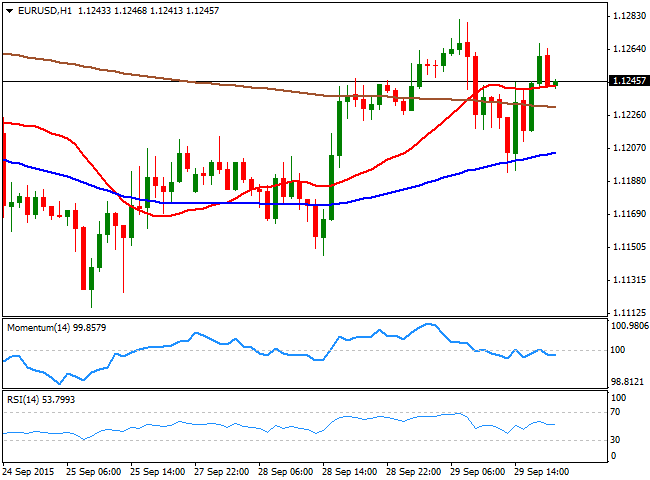
The EUR/USD pair is ending the day pretty much unchanged around the 1.1240 region, in what has been a quite choppy day across financial markets in Europe and the US. Risk sentiment dominated the previous Asian session, leading to some EUR and JPY gains across the board. But the negative sentiment eased with London opening, leading to an intraday decline in those currencies, as stocks recovered ground. European indexes, however, closed slightly lower whilst Wall Street ended the day mixed, and not far from Monday's close, and so did the EUR/USD pair. There was plenty of macroeconomic releases all through the day, but investors pay no attention to them. Among the most relevant were German inflation that fell 0.2% in September, resulting in a 0.0% year-on-year reading. In the US, consumer confidence in the same month jumped to 103.0 against expectations of 96.1.
The short term picture is mild bearish, given that the price is hovering around a horizontal 20 SMA in the 1 hour chart, whilst the technical indicators head lower below their mid-lines, yet as long as above the 1.1200 level, the declines should remain limited. In the 4 hours chart, the technical stance is bullish, as the price is above its 20 SMA that anyway lacks directional strength, whilst the technical indicators are turning slightly higher in neutral territory. In this last time frame, the price is now around its 100 and 200 SMAs, both together and horizontal, reflecting the lack of directional strength.
Support levels: 1.1200 1.1160 1.1120
Resistance levels: 1.1290 1.1335 1.1370
EUR/JPY Current price: 134.63
View Live Chart for the EUR/JPY
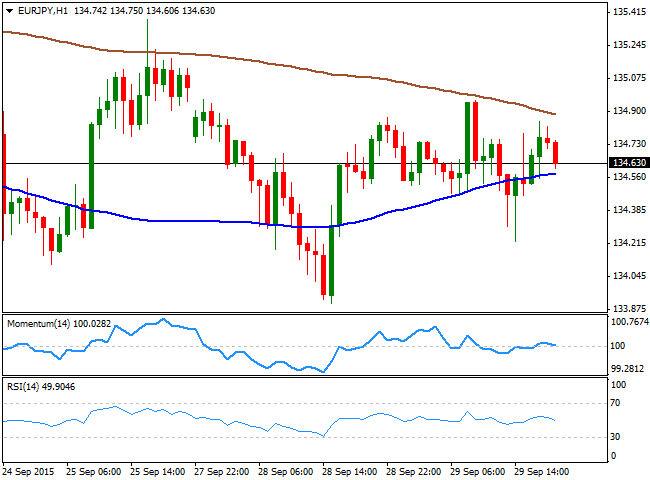
The EUR/JPY pair has shown little progress this Tuesday, as both currencies traded in tandem against its American rival and following market's sentiment. Having held within Monday's range, the daily chart shows that the price continues hovering around the 200 DMA, while the technical indicators stand un negative territory, maintaining the risk towards the downside. In the short term, the price was unable to advance beyond its 200 SMA, now around 134.90, while the technical indicators turn lower around their mid-lines. In the 4 hours chart, the price is below its moving averages, but the technical indicators present a neutral stance, flat around their mid-lines, giving little directional clues for the upcoming hours.
Support levels: 134.40 133.90 133.30
Resistance levels: 134.90 135.35 135.80
GBP/USD Current price: 1.5155
View Live Chart for the GPB/USD
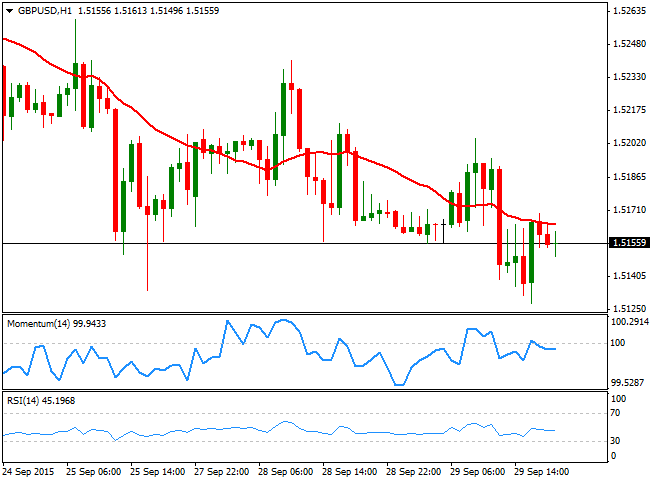
The GBP/USD pair traded in quite a limited range this Tuesday, having extending its monthly decline by a few pips, reaching a fresh low of 1.5128, before bouncing some. Earlier in the day, the pair tried to advanced on an improvement in market sentiment, but selling interest contained the rally around the 1.5200 figure. In the UK, mortgage lending surged in August, rising by the most since May 2008 and reaching 71,030. Net lending to individuals reached £4.3B, favored by low interest rates, and latest BOE's comments as the central bank's Financial Policy Committee has said that it does not expect the growth in the housing sector to undermine the financial stability. Technically, the 1 hour chart presents a mild negative tone, as the price develops below its 20 SMA and the technical indicators present mild bearish slopes below their mid-lines, albeit none showing actual strength. In the 4 hours chart, the technical indicators bounce higher, but remain below their mid-lines, whilst the 20 SMA maintains a strong bearish slope above the current level, all of which maintains the risk towards the downside.
Support levels: 1.5130 1.5090 1.5060
Resistance levels: 1.5200 1.5245 1.5290
USD/JPY Current price: 119.78
View Live Chart for the USD/JPY
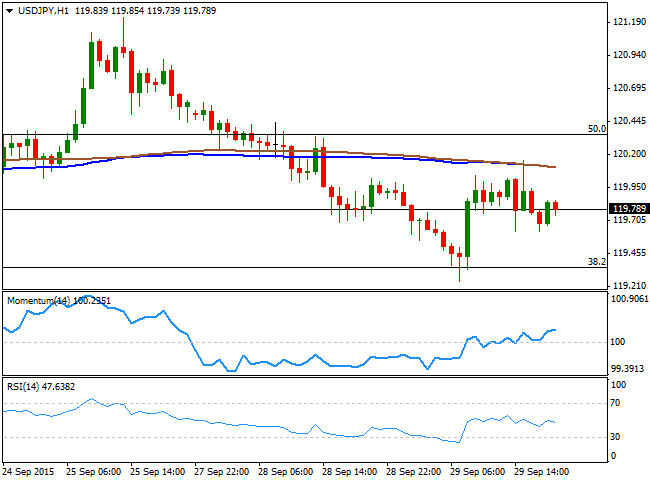
The USD/JPY continues trading within its latest range, having fell down to 119.24 at the beginning of the day and following a strong decline in Asian share markets, recovering up to 120.15 as stocks traded higher in Europe, but once again fading the advance on US indexes limited progress. Overall, the pair is tied to equities markets, which at the same time are dependent on sentiment. Japan will release its Retail Trade and Industrial Production figures for August during the upcoming session, which may see the pair advancing, should the figures disappoint. Technically, the Fibonacci-defined range remains firm in place, as the pair has found buying interest around the 38.2% retracement of its latest weekly decline around 119.35. The 1 hour chart shows that the 100 and 200 SMAs capped the upside around the mentioned daily high and head slightly lower, whilst the technical indicators diverge from each other in neutral territory, reflecting the lack of directional strength. In the 4 hours chart, however, the technical indicators are heading lower below their mid-lines, supporting additional declines for the upcoming hours, particularly on a clear break below the mentioned Fibonacci support.
Support levels: 119.70 119.35 118.90
Resistance levels: 120.35 120.70 121.05
AUD/USD Current price: 0.6982
View Live Chart for the AUD/USD
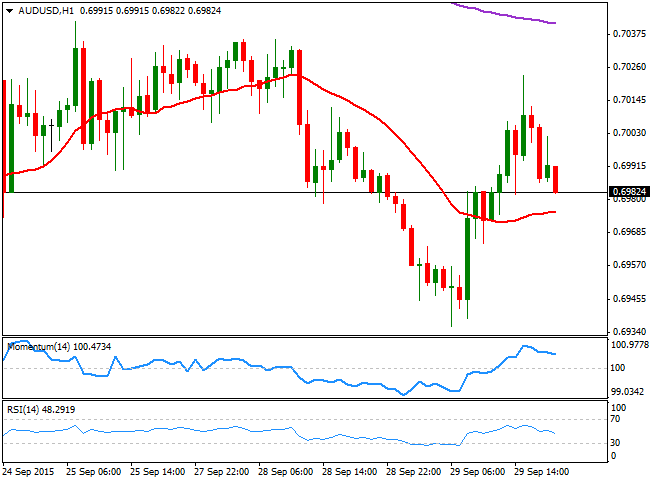
The AUD/USD pair bounced from a daily low of 0.6935 reached at the beginning of the day, extending up to 0.7023, as commodities gained some ground early in the US session, and supported a recovery in mining-related shares that anyway was not enough to erase the latest strong losses. Australia will release housing and credit data during the upcoming hours, and expectations are towards the downside, which means disappointing figures may have a limited effect on the pair. More likely, sentiment will continue leading the way for the commodity-related currency. Technically, the 1 hour chart shows that the price stands a handful of pips above its 20 SMA, whilst the technical indicators are turning lower, with the RSI indicator anticipating additional declines, as it stands around 48. In the 4 hours chart the price has been unable to advance beyond its 20 SMA, whilst the technical indicators are retreating from their mid-lines, pointing for a bearish continuation, particularly on a break below 0.6955, the immediate support.
Support levels: 0.6955 0.6930 0.6900
Resistance levels: 0.7035 0.7070 0.7110
Information on these pages contains forward-looking statements that involve risks and uncertainties. Markets and instruments profiled on this page are for informational purposes only and should not in any way come across as a recommendation to buy or sell in these assets. You should do your own thorough research before making any investment decisions. FXStreet does not in any way guarantee that this information is free from mistakes, errors, or material misstatements. It also does not guarantee that this information is of a timely nature. Investing in Open Markets involves a great deal of risk, including the loss of all or a portion of your investment, as well as emotional distress. All risks, losses and costs associated with investing, including total loss of principal, are your responsibility. The views and opinions expressed in this article are those of the authors and do not necessarily reflect the official policy or position of FXStreet nor its advertisers. The author will not be held responsible for information that is found at the end of links posted on this page.
If not otherwise explicitly mentioned in the body of the article, at the time of writing, the author has no position in any stock mentioned in this article and no business relationship with any company mentioned. The author has not received compensation for writing this article, other than from FXStreet.
FXStreet and the author do not provide personalized recommendations. The author makes no representations as to the accuracy, completeness, or suitability of this information. FXStreet and the author will not be liable for any errors, omissions or any losses, injuries or damages arising from this information and its display or use. Errors and omissions excepted.
The author and FXStreet are not registered investment advisors and nothing in this article is intended to be investment advice.
Recommended Content
Editors’ Picks

EUR/USD stays near 1.0400 in thin holiday trading
EUR/USD trades with mild losses near 1.0400 on Tuesday. The expectation that the US Federal Reserve will deliver fewer rate cuts in 2025 provides some support for the US Dollar. Trading volumes are likely to remain low heading into the Christmas break.

GBP/USD struggles to find direction, holds steady near 1.2550
GBP/USD consolidates in a range at around 1.2550 on Tuesday after closing in negative territory on Monday. The US Dollar preserves its strength and makes it difficult for the pair to gain traction as trading conditions thin out on Christmas Eve.

Gold holds above $2,600, bulls non-committed on hawkish Fed outlook
Gold trades in a narrow channel above $2,600 on Tuesday, albeit lacking strong follow-through buying. Geopolitical tensions and trade war fears lend support to the safe-haven XAU/USD, while the Fed’s hawkish shift acts as a tailwind for the USD and caps the precious metal.

IRS says crypto staking should be taxed in response to lawsuit
In a filing on Monday, the US International Revenue Service stated that the rewards gotten from staking cryptocurrencies should be taxed, responding to a lawsuit from couple Joshua and Jessica Jarrett.

2025 outlook: What is next for developed economies and currencies?
As the door closes in 2024, and while the year feels like it has passed in the blink of an eye, a lot has happened. If I had to summarise it all in four words, it would be: ‘a year of surprises’.

Best Forex Brokers with Low Spreads
VERIFIED Low spreads are crucial for reducing trading costs. Explore top Forex brokers offering competitive spreads and high leverage. Compare options for EUR/USD, GBP/USD, USD/JPY, and Gold.
