EUR/USD Current price: 1.1225
View Live Chart for the EUR/USD
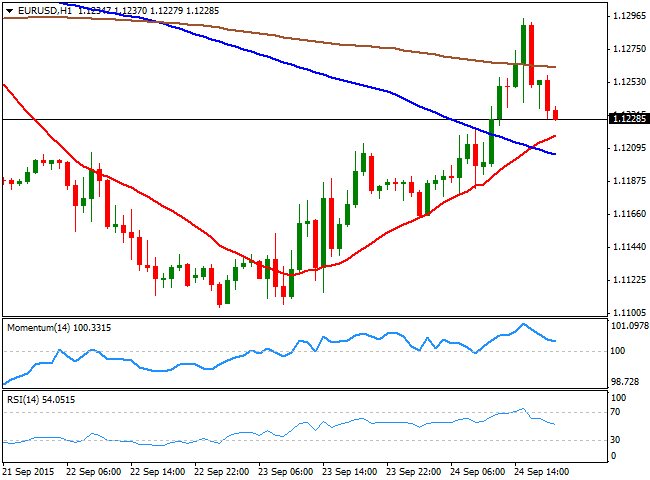
The EUR/USD pair closed Thursday with some gains, as investors once again chose to run towards the funding currency in a strong risk aversion environment, particularly during the first half of the day. The pair traded as high as 1.1295 during the American session, following a sharp decline in local indexes, but pulled back from its highs before the closing bell, and trades back below the key resistance around 1.1245. Daily basis, the pair is still unable to recoup above its 20 SMA, whilst the technical indicators hold a neutral stance, clearly reflecting ongoing investors' uncertainty. Data released early in Europe showed that German consumer confidence is expected to decline in October, from its previous 9.9 to an actual 9.6, although the IFO survey showed that business confidence edged higher in September, climbing to 108.5 from a revised 108.4 in August. In the US, data were mixed, with better than expected weekly unemployment claims, and new home sales, this last up by 5.7% in August, but Durable Goods orders declined in August by 2% whilst the core reading came out flat at 0.0%, continue signaling a tepid recovery in the US at the beginning of the third quarter.Short term, the 1 hour chart shows that the price retreated over 60 pips from its highs, and its approaching a bullish 20 SMA around 1.1210, now the immediate support, whilst the technical indicators maintain their bearish slopes coming from overbought readings, but are still above their mid-lines, far from confirming a downward continuation. In the 4 hours chart, the price is above a bearish 20 SMA, currently around 1.1160, whilst the technical indicators turned south, and are about to cross their mid-line towards the downside, in line with the shorter term view.
Support levels: 1.1210 1.1160 1.1120
Resistance levels: 1.1245 1.1290 1.1335
EUR/JPY Current price: 134.49
View Live Chart for the EUR/JPY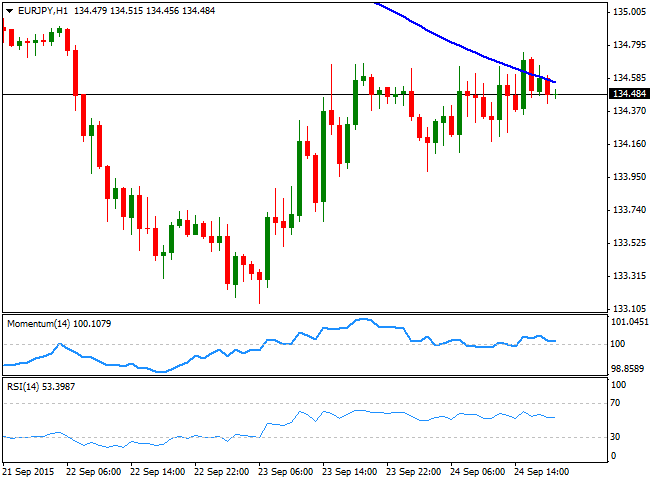
The EUR/JPY pair closed the day pretty much unchanged as the EUR and the JPY moved in tandem against the greenback, all through the day. Hovering around its 200 DMA at 134.40, the short term picture is slightly positive, given that the technical indicators are still above their mid-lines, and the RSI aims higher around 54, although the price is unable to advance beyond a strongly bearish 20 SMA and remains stuck around it. In the 4 hours chart, the outlook is mixed, as the Momentum indicator heads higher above its 100 level, but the RSI indicator turned south around 47, while the price remains well below its moving averages, with the 100 SMA now around 135.00, the level to break to confirm an upward continuation for this Friday.
Support levels: 134.40 133.90 133.30
Resistance levels: 135.00 135.50 135.85
GBP/USD Current price: 1.5229
View Live Chart for the GPB/USD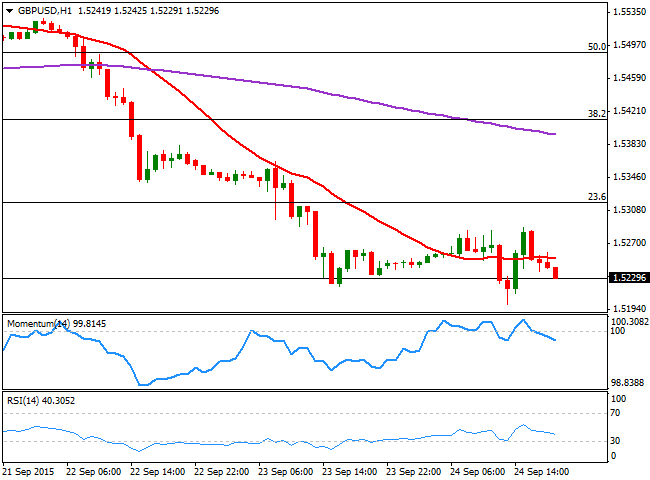
The GBP/USD pair extended its decline down to 1.5199, maintaining the negative tone all through the day. The UK released its BBA mortgage approvals data earlier in the day, showing that mortgage borrowing continued to pick up in August according to the report, with active mortgages surging to 46.743K. The pair advanced intraday up to 1.5288, as the dollar fell with Wall Street opening, but reversed course and points to close the day once again in the red. Short term, the 1 hour chart shows that the price is now below a horizontal 20 SMA, which converges with a static resistance level at 1.5250, whilst the technical indicators entered negative territory and maintain their bearish slopes. In the 4 hours chart, the technical indicators hover near oversold territory with limited bearish slopes, whilst the 20 SMA has extended its sharp decline stands now at around 1.5350. Renewed selling interest that sends the pair below 1.5200 should lead to a test of 1.5160, this month low, whilst a break below it should see the bearish momentum accelerating towards the 1.5100 region.
Support levels: 1.5200 1.5160 1.5125
Resistance levels: 1.5250 1.5290 1.5330
USD/JPY Current price: 120.02
View Live Chart for the USD/JPY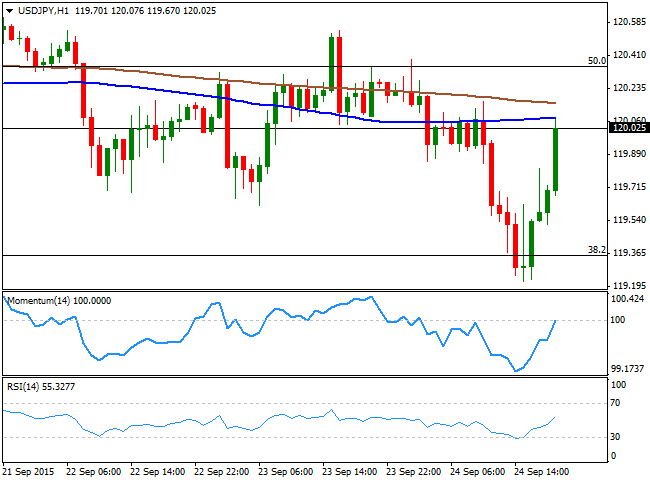
The USD/JPY pair sunk to near the base of this last month range, posting 119.21 before bouncing back sharply in the American afternoon, recovering alongside with Wall Street, which erased most of its intraday losses before the closing bell. The Japanese yen has been trading purely on sentiment, strengthening despite poor Markit manufacturing readings in Japan, showing the economic slowdown coming from China continues spreading into the region. The pair is pressuring the 120.00 level ahead of the Asian opening, with the 1 hour chart showing that the technical indicators have bounced sharply from oversold levels and are aiming to cross their mid-lines towards the upside, whilst the 100 and 200 SMAs, stand flat a few pips above the current level. In the 4 hours chart, the price is back around an horizontal 20 SMA, whilst the technical indicators aim higher around their mid-lines. Overall, the pair maintains the neutral tone seen on previous updates, still contained within Fibonacci levels, and will likely remain so until the next Friday October 2nd, when the US will release its September Payrolls figures.
Support levels: 119.70 119.35 118.90
Resistance levels: 120.00 120.35 120.70
AUD/USD Current price: 0.7026
View Live Chart for the AUD/USD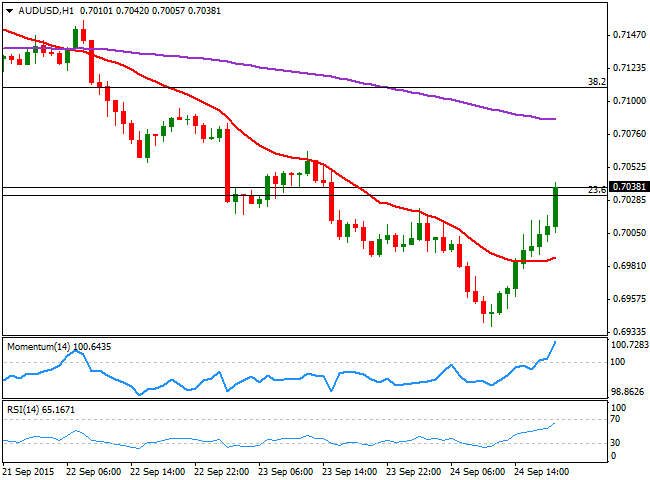
The AUD/USD pair sunk to a daily low of 0.6938, before turning sharply higher mid American afternoon, advancing up to 0.7042 before finally stalling. The Aussie suffered by a poor performance in the price of metals, and a steady decline in worldwide stocks during the first half of the day, with the late recovery being a reflection of Wall Street's advance. Technically, the 1 hour chart shows that the price is hovering around the 23.6% retracement of its latest bearish decline, whilst the technical indicators have lost their upward strength, but remain well into positive territory, as the 20 SMA turns higher below the current price. In the 4 hours chart, the technical indicators head higher below their mid-lines, but are far from confirming additional advances, whilst the 20 SMA maintains a strong bearish slope, providing a strong intraday resistance around 0.7050.
Support levels: 0.6954 0.6906 0.6870
Resistance levels: 0.6990 0.7035 0.7070
Information on these pages contains forward-looking statements that involve risks and uncertainties. Markets and instruments profiled on this page are for informational purposes only and should not in any way come across as a recommendation to buy or sell in these assets. You should do your own thorough research before making any investment decisions. FXStreet does not in any way guarantee that this information is free from mistakes, errors, or material misstatements. It also does not guarantee that this information is of a timely nature. Investing in Open Markets involves a great deal of risk, including the loss of all or a portion of your investment, as well as emotional distress. All risks, losses and costs associated with investing, including total loss of principal, are your responsibility. The views and opinions expressed in this article are those of the authors and do not necessarily reflect the official policy or position of FXStreet nor its advertisers. The author will not be held responsible for information that is found at the end of links posted on this page.
If not otherwise explicitly mentioned in the body of the article, at the time of writing, the author has no position in any stock mentioned in this article and no business relationship with any company mentioned. The author has not received compensation for writing this article, other than from FXStreet.
FXStreet and the author do not provide personalized recommendations. The author makes no representations as to the accuracy, completeness, or suitability of this information. FXStreet and the author will not be liable for any errors, omissions or any losses, injuries or damages arising from this information and its display or use. Errors and omissions excepted.
The author and FXStreet are not registered investment advisors and nothing in this article is intended to be investment advice.
Recommended Content
Editors’ Picks

EUR/USD declines below 1.0300 ahead of US data
EUR/USD stays under heavy selling pressure and trades below 1.0300 on Wednesday. News of US President-elect Donald Trump planning to declare an economic emergency to allow for a new tariff plan weighs on risk mood and boosts the USD ahead of key data releases.

GBP/USD drops to fresh multi-month lows below 1.2400
GBP/USD remains on the back foot and trades at its weakest level since April below 1.2400. The risk-averse market atmosphere on growing concerns over an aggressive tariff policy by President-elect Donald Trump drags the pair lower as focus shifts to US data.

Gold stabilizes near $2,650; upside seems limited ahead of FOMC Minutes
Gold price (XAU/USD) fluctuates in a narrow range at around $2,650 on Wednesday. The benchmark 10-year US Treasury bond yield holds at its highest level since late April near 4.7%, making it difficult for XAU/USD ahead of FOMC Minutes.

ADP Employment Change expected to show modest slowdown in December
The ADP Employment Change report for December will be released on Wednesday at 13:15 GMT. It’s expected to show that the US private sector added 140K new jobs after gaining 146K in November.

Five fundamentals for the week: Nonfarm Payrolls to keep traders on edge in first full week of 2025 Premium
Did the US economy enjoy a strong finish to 2024? That is the question in the first full week of trading in 2025. The all-important NFP stand out, but a look at the Federal Reserve and the Chinese economy is also of interest.

Best Forex Brokers with Low Spreads
VERIFIED Low spreads are crucial for reducing trading costs. Explore top Forex brokers offering competitive spreads and high leverage. Compare options for EUR/USD, GBP/USD, USD/JPY, and Gold.
