EUR/USD Current price: 1.1310
View Live Chart for the EUR/USD
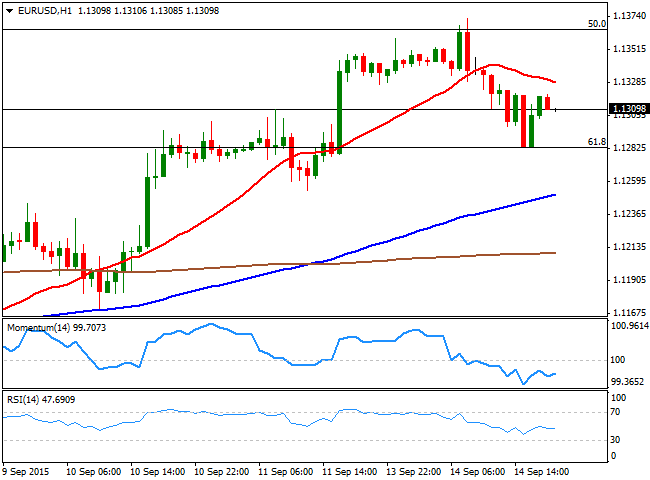
The EUR/USD pair traded quite choppy this Monday, surging up to 1.1372 at the beginning of the European session, as Asian stocks closed in the red, on renewed concerns over China. The pair slowly retreated from the level, even despite EU Industrial Production data for July surprised to the upside, resulting in an increase of 0.6% monthly basis, and 1.9% compared to a year before.
The pair fell down to 1.1282 early in the American session, bouncing from a major Fibonacci support, the 61.8% retracement of the 1.1017/1.1713 advance, ending the day a few pips above the 1.1300 level. As expected, the pair lacks clear directional strength ahead of the upcoming FED's meeting starting next Wednesday, as investors are wary of driving currencies' prices far away at this point. Technically, a negative tone prevails in the short term, as the 1 hour chart shows that the price is below a bearish 20 SMA, whilst the technical indicators head slightly lower below their mid-lines. In the 4 hours chart, the 20 SMA advanced further higher below the current level, now around the 1.1280 region, whilst the technical indicators hold above their mid-lines, but showing no actual directional strength.
Support levels: 1.1280 1.1240 1.1200
Resistance levels: 1.1335 1.1365 1.1400
EUR/JPY Current price: 135.78
View Live Chart for the EUR/JPY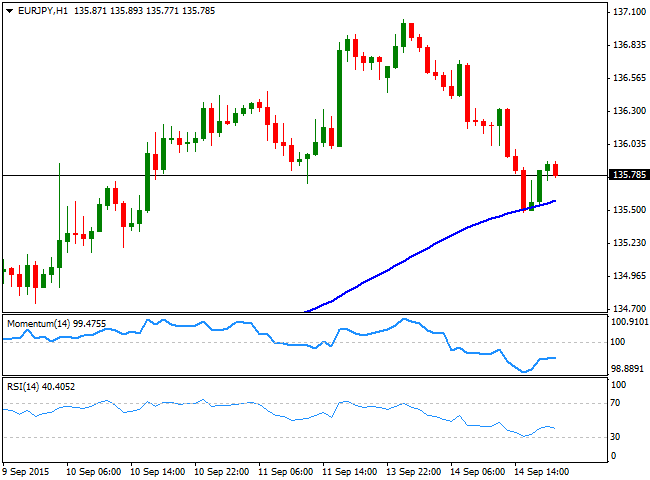
The EUR/JPY pair slid down to 135.48 this Monday, as the risk aversion triggered during Asian hours spurred demand for the safe-haven yen. A weakening EUR added to the bearish tone of the pair, and the 1 hour chart shows that the price posted a shallow bounce from a still bullish 100 SMA, although the technical indicators are now turning lower, well below their mid-lines, suggesting the risk remains towards the downside. In the 4 hours chart, the technical indicators corrected the extreme overbought readings reached last Friday, and are now posting limited bounces from their mid-lines, but with no actual strength and therefore far from confirming additional advances. At this point, the pair needs to recover above the 136.30 level, to recover its bullish strength, whilst renewed selling pressure below 135.40, exposes the pair to additional declines over the upcoming sessions.
Support levels: 135.40 134.90 134.50
Resistance levels: 136.30 136.70 137.25
GBP/USD Current price: 1.5421
View Live Chart for the GPB/USD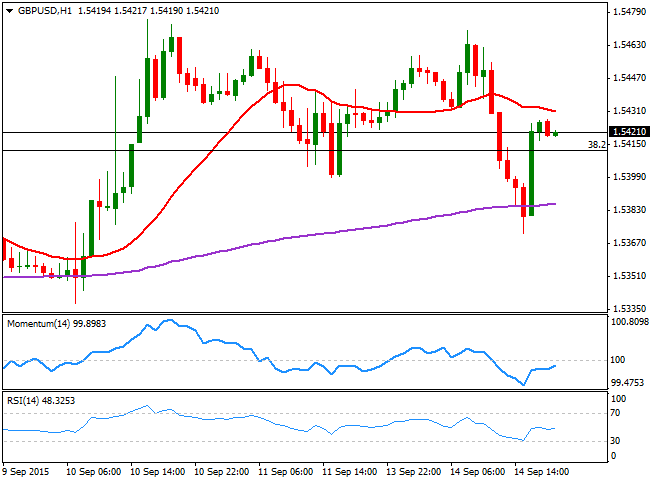
The GBP/USD pair established a daily high at 1.5470, from where it slowly slid down to 1.5372, with nothing behind the move, but nervous investors. The UK released no macroeconomic readings, but will be pretty busy this Tuesday, with the release of several inflation figures, including a house price index for August, generally expected weaker than previous. Should the figures overcome expectations, the Pound can get a boost, given that is probably the only currency able to run against the greenback these days, as the BOE is also entering the tightening path. In the meantime, the 1 hour chart shows that the pair recovered sharply by London's close, holding into its gains above the 1.5410 level by the end of the day. The technical indicators in the mentioned time frame however, have lost their upward potential below their mid-lines, whilst the 20 SMA is flat above the current level, limiting the upside at the time being. In the 4 hours chart, the 20 SMA converges with the 38.2% retracement of the latest daily decline around 1.5410 offering an immediate support, whilst the Momentum indicator holds flat around its 100 level, and the RSI indicator aims higher around 54.
Support levels: 1.5410 1.5370 1.5320
Resistance levels: 1.5450 1.5490 1.5525
USD/JPY Current price: 120.02
View Live Chart for the USD/JPY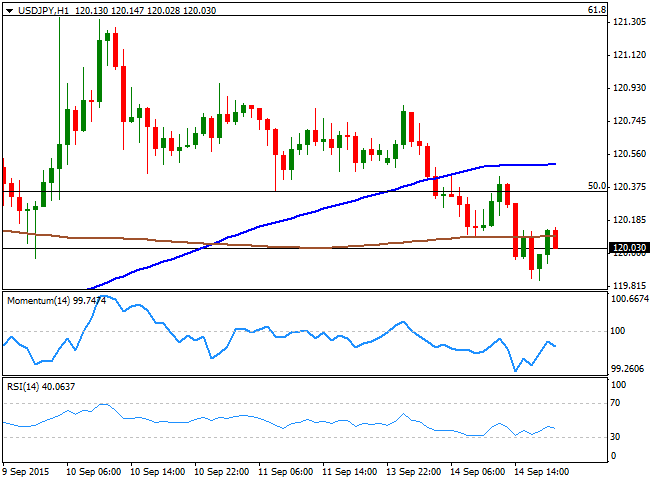
The Japanese yen appreciated against its American rival, with the USD/JPY reaching a daily low of 119.84 during the American afternoon, overall maintaining a heavy tone ahead of the upcoming BOJ economic policy meeting during the upcoming Asian session. The Bank of Japan is widely expected to maintain its current stimulus program unchanged, despite pressure has been mounting over the need of more action, which is seen for September. If the Central Bank surprises markets with more easing, some wild moves are expected in all yen crosses, with a steep decline of the currency seen after the announcement. In the meantime, the short term technical picture favors a continued slide, as the 1 hour chart shows that the price is well below its 100 SMA, around 120.50, and unable to advance above the 200 SMA, a few pips above the current level, whilst the technical indicators turned south in negative territory. In the 4 hours chart, the RSI indicator maintains its bearish slope around 41, whilst the Momentum indicator posts a tepid bounce below the 100 level, in line with the shorter term view.
Support levels: 119.90 119.60 119.25
Resistance levels: 121.35 121.80 122.20
AUD/USD Current price: 0.7135
View Live Chart for the AUD/USD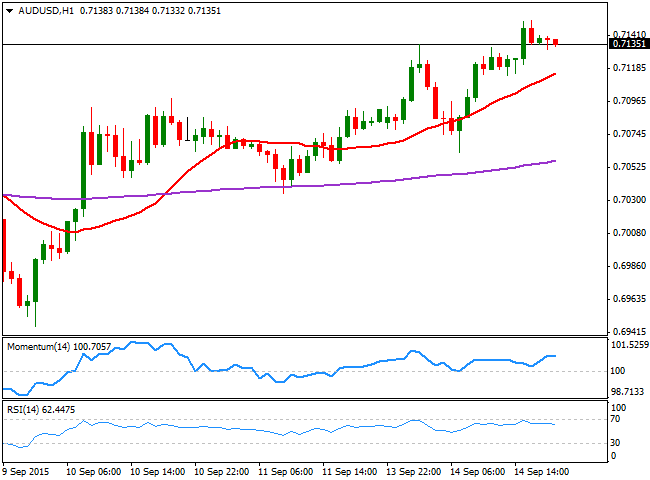
The Australian dollar closed with some solid gains against the greenback, surging up to 0.7150, a fresh 2-week high, holding nearby by the end of the day. The sentiment towards the Aussie has been strong ever since the pair bottomed around 0.6900 earlier this month, and an overall bullish sentiment, despite Chinese woes prevails. During the upcoming hours, the RBA will release the Minutes of its latest meeting, although the theme of the day has been that former Cabinet Minister Malcolm Turnbull challenged PM Tony Abbott leadership, imposing himself by 54 votes to 44 among the ruling party, resulting in the sixth prime minister in eight years. The news had little impact on the currency so far, although it can result in some local turmoil during the upcoming days. Technically, the 1 hour chart shows that the technical indicators have lost their upward strength near overbought levels, but with the price consolidating well above a bullish 20 SMA, the downside seems limited. In the 4 hours chart, the 20 SMA continues providing a dynamic support now around 0.7070, whilst the RSI indicator hovers around overbought territory and the Momentum indicator aims higher above its mid-line, supporting further gains ahead.
Support levels: 0.7105 0.7070 0.7030
Resistance levels: 0.7150 0.7190 0.7240
Recommended Content
Editors’ Picks

EUR/USD: Recovery remains capped below 1.0300
EUR/USD is consolidating its recovery below 1.0300 in the European morning on Friday. The pair breathes a sigh of relief as the US Dollar rally stalls even as markets stay cautious amid geopolitical risks and Trump's tariff plans. The focus remains on US ISM PMI data and central bank talks.

GBP/USD retakes 1.2400, as focus shifts to US ISM PMI data
GBP/USD rebounds to test 1.2400 in the European session on Friday. A minor pullback in the US Dollar allows the pair to find some respite after having lost over 1% on the outset of the New Year on Thursday. All eyes remain on the US ISM PMI data and Fedspeak for further impetus.

Gold takes out all key resistance levels; where next?
Gold price consolidates a two-day upsurge above $2,650 early Friday. The US Dollar stalls its uptrend amid sluggish US Treasury bond yields and a cautious mood. Gold price cheers geopolitical woes and a bullish daily RSI as buyers scale all key technical hurdles.

Bitcoin, Ethereum and Ripple eyes for a rally
Bitcoin’s price finds support around its key level, while Ethereum’s price is approaching its key resistance level; a firm close above it would signal a bullish trend. Ripple price trades within a symmetrical triangle on Friday, a breakout from which could signal a rally ahead.

Three Fundamentals: Year-end flows, Jobless Claims and ISM Manufacturing PMI stand out Premium
Money managers may adjust their portfolios ahead of the year-end. Weekly US Jobless Claims serve as the first meaningful release in 2025. The ISM Manufacturing PMI provides an initial indication ahead of Nonfarm Payrolls.

Best Forex Brokers with Low Spreads
VERIFIED Low spreads are crucial for reducing trading costs. Explore top Forex brokers offering competitive spreads and high leverage. Compare options for EUR/USD, GBP/USD, USD/JPY, and Gold.