EUR/USD Current price: 1.1164
View Live Chart for the EUR/USD
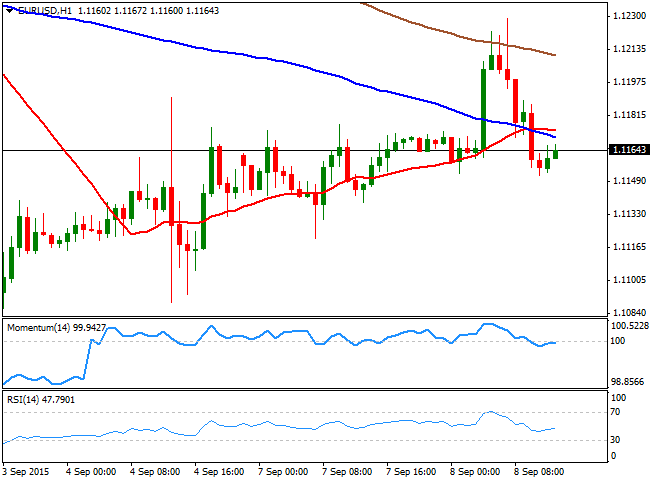
The EUR/USD pair trades near its daily low of 1.1151, unable to advance despite the general improvement in risk sentiment all through financial markets. A strong opening in European share markets helped the pair to post a daily high of 1.1228, although the pair retreated back below the 1.1200 level on strong selling interest waiting for higher levels. Macroeconomic data was better-than-expected in the euro zone, with the EU GDP up 0.4% in the second quarter, and German Trade balance posting a surplus of €22.8B. Ahead of the US opening, the pair presents a mild negative tone in the short term, as the 1 hour chart shows that the price is extending below its 20 SMA, whilst the technical indicators are heading lower in negative territory. In the 4 hours chart, the price is a few pips above a bearish 20 SMA, whilst the technical indicators hold flat around their mid-lines, showing no directional strength at the time being. The immediate support comes at 1.1120, this week low, whilst a recovery above 1.1190 is required to confirm additional advances beyond the mentioned daily high.
Support levels: 1.1120 1.1080 1.1050
Resistance levels: 1.1190 1.1230 1.1265
GBP/USD Current price: 1.5411
View Live Chart for the GPB/USD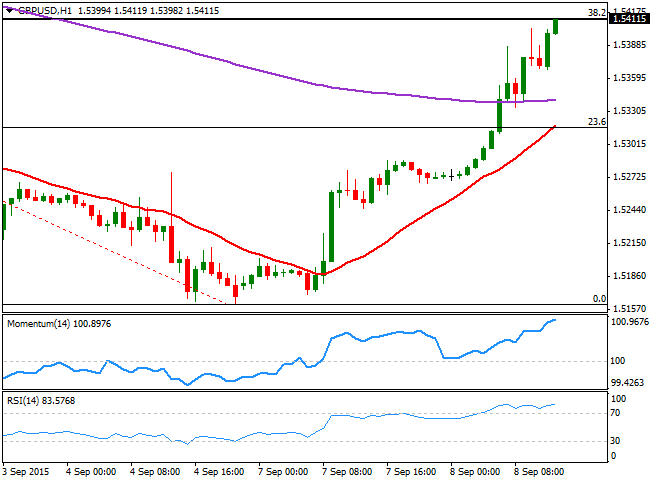
The GBP/USD pair extends its upward correction this Tuesday, with the price advancing above the 1.5400 level and reaching a fresh 6-day high, mostly due to a sudden return of risk appetite. The pair has reached a critical resistance level, the 38.2% retracement of its latest decline, with the 1 hour chart showing that the technical indicators are at extreme overbought levels, beginning to lose their upward strength but far from suggesting a reversal. In the same chart, the 20 SMA heads sharply higher around the 23.6% retracement of the same rally around 1.5320, suggesting some consolidation ahead before the next directional move. In the 4 hours chart, the technical indicators maintain their strong upward momentum, despite being in overbought territory, suggesting a later break higher towards 1.5490, the next Fibonacci resistance.
Support levels: 1.5360 1.5320 1.5285
Resistance levels: 1.5415 1.5450 1.5490
USD/JPY Current price: 119.90
View Live Chart for the USD/JPY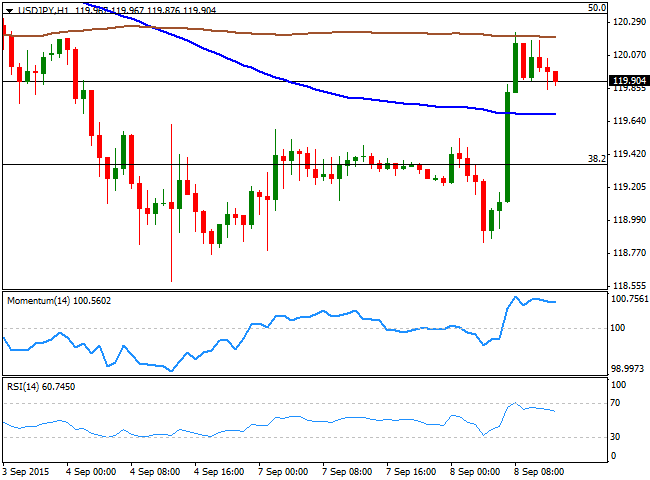
The USD/JPY pair advanced up to 120.22, meeting intraday selling interest around its hourly 200 SMA. During the Asian session, Japan released its GDP figures for the Q2, slightly better than expected, although yen weakness was more related to Nikkei's strength. The short term picture is slightly bullish, although the pair needs to extend beyond 120.40 to confirm a stronger upward momentum. The 1hour chart shows that the technical indicators have lost their upward strength, but remain in positive territory, whilst the 100 SMA provides an immediate short term support around 119.60. In the 4 hours chart the technical indicators retain a positive tone above their mid-lines, although the 100 SMA continues heading south well above the current price.
Support levels: 119.60 119.25 118.90
Resistance levels: 120.10 120.40 120.85
AUD/USD Current price: 0.6993
View Live Chart for the AUD/USD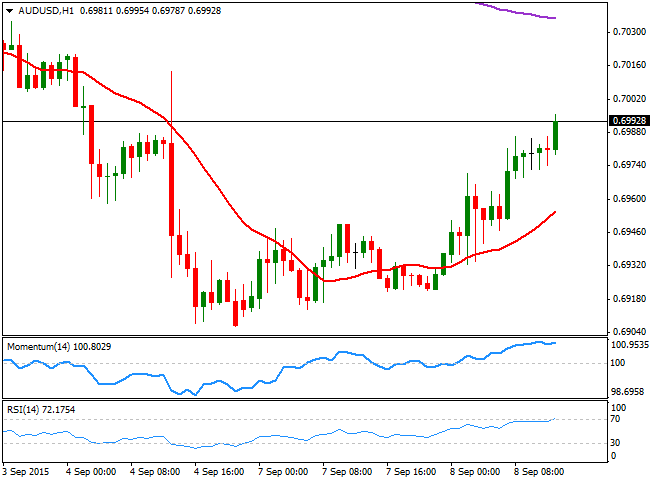
The AUD/USD pair flirts with the 0.7000 level, extending its latest recovery and with a short term positive tone, although far from reversing the dominant bearish trend. The 1 hour chart shows that the technical indicators are steady near overbought levels, whilst the technical indicators head higher below the current level. In the 4 hours chart, the price has advanced beyond its 20 SMA, although the technical indicators have turned flat around their mid-lines, losing their upward strength. Should US stocks extend their advance, the pair may extend its recovery, with the next short term resistance at 0.7040, a strong static level.
Support levels: 0.6965 0.6930 0.6900
Resistance levels: 0.7000 0.7040 0.7090
Recommended Content
Editors’ Picks

EUR/USD treads water just above 1.0400 post-US data
Another sign of the good health of the US economy came in response to firm flash US Manufacturing and Services PMIs, which in turn reinforced further the already strong performance of the US Dollar, relegating EUR/USD to the 1.0400 neighbourhood on Friday.
GBP/USD remains depressed near 1.2520 on stronger Dollar
Poor results from the UK docket kept the British pound on the back foot on Thursday, hovering around the low-1.2500s in a context of generalized weakness in the risk-linked galaxy vs. another outstanding day in the Greenback.

Gold keeps the bid bias unchanged near $2,700
Persistent safe haven demand continues to prop up the march north in Gold prices so far on Friday, hitting new two-week tops past the key $2,700 mark per troy ounce despite extra strength in the Greenback and mixed US yields.

Geopolitics back on the radar
Rising tensions between Russia and Ukraine caused renewed unease in the markets this week. Putin signed an amendment to Russian nuclear doctrine, which allows Russia to use nuclear weapons for retaliating against strikes carried out with conventional weapons.

Eurozone PMI sounds the alarm about growth once more
The composite PMI dropped from 50 to 48.1, once more stressing growth concerns for the eurozone. Hard data has actually come in better than expected recently – so ahead of the December meeting, the ECB has to figure out whether this is the PMI crying wolf or whether it should take this signal seriously. We think it’s the latter.

Best Forex Brokers with Low Spreads
VERIFIED Low spreads are crucial for reducing trading costs. Explore top Forex brokers offering competitive spreads and high leverage. Compare options for EUR/USD, GBP/USD, USD/JPY, and Gold.