EUR/USD Current price: 1.1143
View Live Chart for the EUR/USD
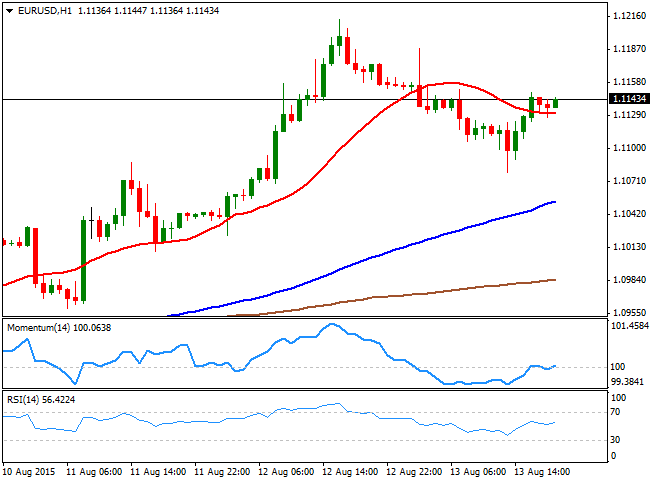
China gathered all of the attention for a third day in a row, as the PBoC fixed the reference rate for the Yuan 1.1% lower, completing a 4.66% devaluation in the same period. The Central Bank released a statement in which they announced that they are now "implementing the managed floating exchange rate regime based on market demand and supply," suggesting intervention is over, at least for now. The market felt less the impact of this last movement, with stocks recovering some ground alongside with the greenback, although none was able to completely erase its latest losses. Germany released its monthly inflation figures for July, which matched expectations, with the CPI up 0.2% monthly basis, barely affecting the market. In the US, weekly unemployment claims rose to 274K in the week ended Aug 7, whilst the 4-week average declined to the lowest level in more than 15 years. Retail sales rose 0.6% in July, suggesting consumption is propelling growth in the country. The data gave a temporal boost to the dollar, which sent the EUR/USD down to a daily low of 1.1079.
Nevertheless, the pair recovered ground in the American afternoon, surging back above the 1.1120 level, and presents a mild positive short term tone, as in the 1 hour chart, the price is now hovering above its 20 SMA, whilst the technical indicators erased early oversold readings and consolidate now around their mid-lines. In the 4 hours chart the pair has bounced sharply from a bullish 20 SMA, the Momentum indicator heads lower well above its 100 level, whilst the RSI indicator turns slightly higher around 64.00, suggesting limited downward potential as long as the price holds above 1.1120. Renewed buying interest above 1.1160 on the other hand, should favor additional advances up to 1.1240 a strong static resistance level.
Support levels: 1.1120 1.1080 1.1045
Resistance levels: 1.1160 1.1195 1.1240
EUR/JPY Current Price: 138.54
View Live Chart for the EUR/JPY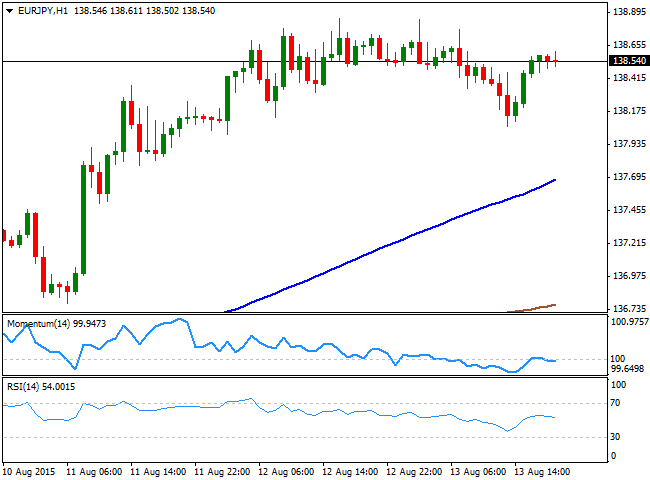
The EUR/JPY closes the day flat, having consolidated its latest gains in a tight intraday range. The Japanese yen saw some limited intraday demand that gave back following positive US data. Technically, however, the short term picture presents a mild negative tone, as in the 1 hour chart, the technical indicators are turning south around their mid-lines. In the same chart, the 100 SMA have advanced further below the current price, now around 137.70 and containing the downside in the case of a sharp decline. In the 4 hours chart, the RSI indicator has turned flat in overbought levels, whilst the RSI indicator turned lower, and is now approaching its mid-line. Nevertheless, price action suggest the upside is favored, with some steady advance beyond 138.90 required to confirm additional advances.
Support levels: 138.40 137.80 137.30
Resistance levels: 138.90 139.50 140.10
GBP/USD Current price: 1.5605
View Live Chart for the GPB/USD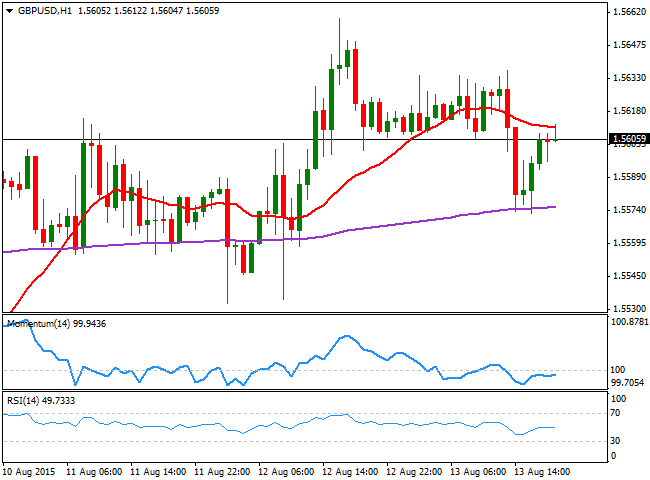
The GBP/USD pair traded within Wednesday range, ending the day pretty much flat around 1.5600. There were no fundamental releases in the UK, and the calendar will also remain empty on Friday, pointing for a continuation on the ongoing range in the pair. There is, however, some signs that the pair may finally break to the upside, as in the daily chart, the 100 DMA crossed above the 200 DMA, for the first time in over a year and a half. Still, the pair has been finding strong selling interest in the 1.5670 region, which means some additional technical confirmations are required before buying. Short term, the 1 hour chart maintains a neutral-to-bearish stance, as the technical indicators hold below their mid-lines, whilst the price is now being capped by a horizontal 20 SMA. In the 4 hours chart, the technical indicators are aiming higher also in neutral territory, whilst the price is now above a bullish 20 SMA, in line with the longer term perspective.
Support levels: 1.5580 1.5540 1.5500
Resistance levels: 1.5635 1.5760 1.5710
USD/JPY Current price: 124.40
View Live Chart for the USD/JPY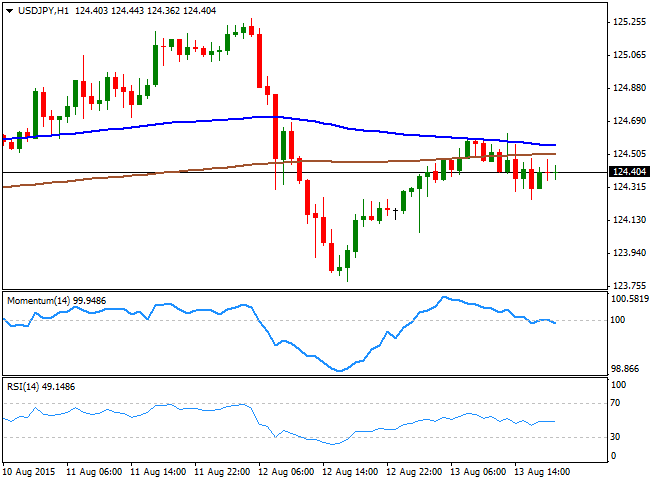
The USD/JPY pair recovered from Wednesday's low, surging up to 124.62 intraday, from where the pair faded in the American afternoon, holding anyway above the 124.00 level by the end of the day. The pair retraced half of its previous losses before resuming its decline, increasing the risk of a downward break for this Friday. Additionally the 1 hour chart shows that the price stalled around its 100 SMA, whilst the technical indicators extended their decline from overbought territory, now crossing their mid-lines towards the downside. In the 4 hours chart the technical indicators are also biased lower, but well below their mid-lines, whilst the price holds above horizontal moving averages. The immediate support stands at 124.00, yet a break below 123.70 is required to confirm a new leg lower, while selling interest is expected to surge on approaches to the 125.00 level.
Support levels: 124.00 123.70 123.30
Resistance levels: 124.50 124.95 125.40
AUD/USD Current price: 0.7361
View Live Chart for the AUD/USD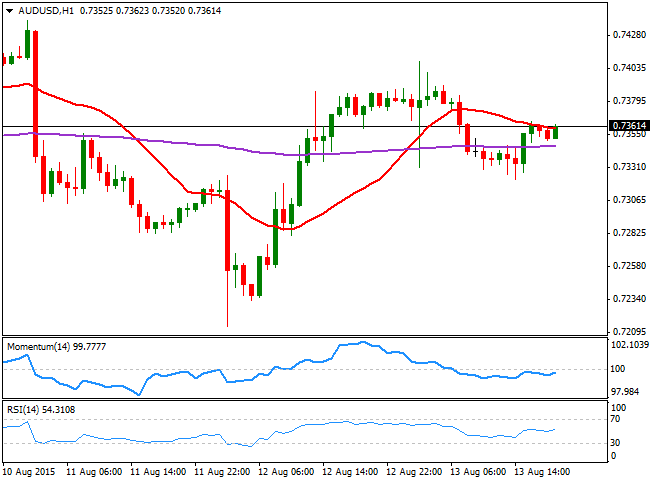
The Australian dollar edged lower against the greenback, weighed by Chinese's Central Bank decision on the Yuan, and a retracement in gold prices. The AUD/USD pair spiked up to 0.7408 during the Asian session, once again meeting selling interest in the region, falling down to 0.7322 before recovering some ground. Ahead of the Asian opening, the upside seems limited in the short term, as the price is fighting around a bearish 20 SMA, whilst the technical indicators aim higher around their mid-lines. In the 4 hours chart the price is above a flat 20 SMA, currently around 0.7330, whilst the technical indicators have lost their upward strength, but hold in positive territory. In this last chart, the 200 EMA stands around 0.7415, offering a strong resistance level, yet only beyond 0.7450 the upside is open for a steadier advance over the upcoming sessions.
Support levels: 0.7330 0.7295 0.7250
Resistance levels: 0.7370 0.7415 0.7450
Recommended Content
Editors’ Picks

AUD/USD appreciates as US Dollar remains subdued after a softer inflation report
The Australian Dollar steadies following two days of gains on Monday as the US Dollar remains subdued following the Personal Consumption Expenditures Price Index data from the United States released on Friday.

USD/JPY consolidates around 156.50 area; bullish bias remains
USD/JPY holds steady around the mid-156.00s at the start of a new week and for now, seems to have stalled a modest pullback from the 158.00 neighborhood, or over a five-month top touched on Friday. Doubts over when the BoJ could hike rates again and a positive risk tone undermine the safe-haven JPY.

Gold downside bias remains intact while below $2,645
Gold price is looking to extend its recovery from monthly lows into a third day on Monday as buyers hold their grip above the $2,600 mark. However, the further upside appears elusive amid a broad US Dollar bounce and a pause in the decline of US Treasury bond yields.

Week ahead: No festive cheer for the markets after hawkish Fed
US and Japanese data in focus as markets wind down for Christmas. Gold and stocks bruised by Fed, but can the US dollar extend its gains? Risk of volatility amid thin trading and Treasury auctions.
Bank of England stays on hold, but a dovish front is building
Bank of England rates were maintained at 4.75% today, in line with expectations. However, the 6-3 vote split sent a moderately dovish signal to markets, prompting some dovish repricing and a weaker pound. We remain more dovish than market pricing for 2025.

Best Forex Brokers with Low Spreads
VERIFIED Low spreads are crucial for reducing trading costs. Explore top Forex brokers offering competitive spreads and high leverage. Compare options for EUR/USD, GBP/USD, USD/JPY, and Gold.