EUR/USD Current price: 1.1005
View Live Chart for the EUR/USD
The EUR jumped against the greenback to a daily high of 1.1196 after Europe announced they came to a deal with Greece. The country was forced into harsher terms that those rejected by voters in the referendum that took place last July 5th, and is just the base for an agreement, as the Greek Parliament is still to approve it before the real negotiations begin. Among others, the creditors have demanded pension cuts, higher taxes, and the creation of an independent fund, to which the Greek government should transfer €50bn of Greek assets that will be monetize for privatization, bank recapitalization and/or debt repayment. Tsipras on the other hand, said that creditors also compromised to do some debt restructuring. In the meantime, Greeks bank´s holiday has been extended through July 15th, and the general sense is that, despite there will be no Grexit, the solution is just temporal, as it will end up meaning further recessional pressures for the country that will end up with a larger, unaffordable debt, in a few years.
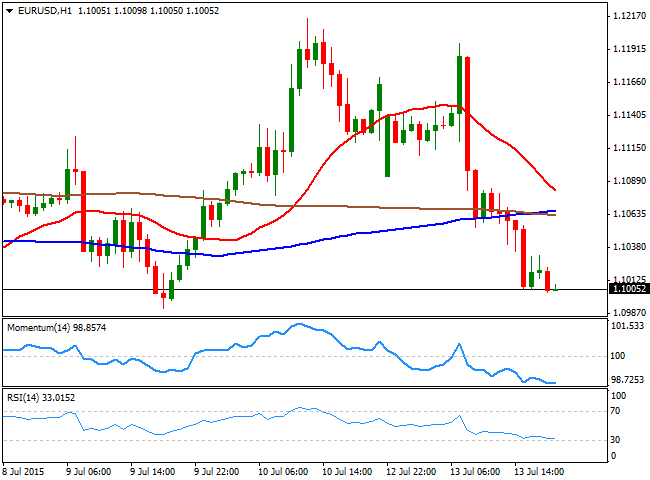
The EUR/USD however, sunk after the initial spike, falling down to 1.1000 by the end of the US session, as investors flipped back towards the greenback and stocks. Also, with a Grexit out of the picture, the market is focusing back on Central Bank imbalances. Technically the 1 hour chart favors additional declines, as the price has extended below its moving averages, whilst the technical indicators maintain their bearish slopes, despite being in oversold territory. In the 4 hours chart, the bearish tone is also present, albeit lacking momentum, as the technical indicators stand flat below their mid-lines. Considering the wide intraday ranges seen lately, the price needs now to extend below the 1.0955 region to be able to extend its decline towards the 1.0820 region, the next strong midterm support.
Support levels: 1.1000 1.0955 1.0920
Resistance levels: 1.1050 1.1120 1.1160
EUR/JPY Current Price: 135.80
View Live Chart for the EUR/JPY
The EUR/JPY pair has seen soared up to 137.79, a 2-week high early in the European morning, but finally gave back all of its intraday gains, closing in the red on EUR self weakness, as the Japanese yen edged sharply lower against the greenback. As for the EUR/JPY, the 1 hour chart shows that the price holds above its moving averages, with the 200 SMA providing an immediate support around 135.45, whilst the technical indicators present a mild bearish tone in negative territory, keeping the risk towards the downside. In the 4 hours chart, the rally stalled around the 200 SMA, while the price retreated back below a bearish 100 SMA. Nevertheless, in this last time frame, the technical indicators have retreated from overbought levels, but remain above their mid-lines, losing their bearish slopes. Additional declines are required to confirm a new leg lower, targeting the 134.40 as a probable bearish target for this Tuesday.
Support levels: 135.45 134.90 134.40
Resistance levels: 136.10 136.55 137.00
GBP/USD Current price: 1.5485
View Live Chart for the GPB/USD
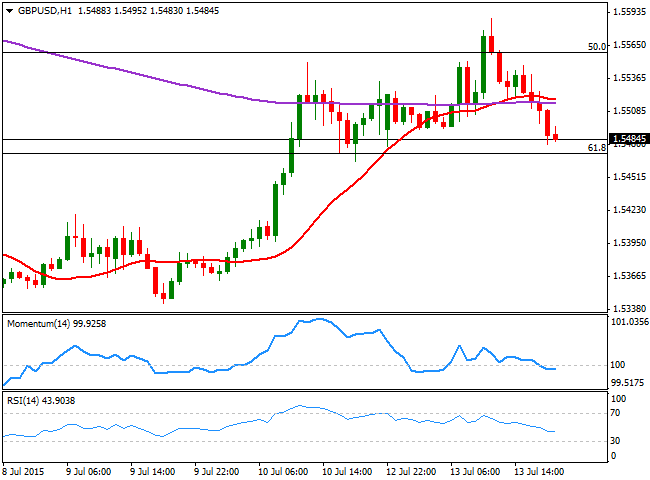
The British Pound finally capitulated to dollar's demand, with the pair closing the day below the 1.5500 level, after surging to 1.5588 early Europe. On Tuesday, the UK will release its inflation figures for June, and whilst Producer Price indexes are expected to improve slightly, the annual rate of the UK CPI is expected to have remained unchanged at 0.1% in June, which should give little support to the Pound, unless the readings surprise to the upside. Technically, the 1 hour chart shows that the price is approaching to a key Fibonacci support at 1.5475, whilst the price develops below its moving averages and the technical indicators head slightly lower below their mid-lines. In the 4 hours chart, the technical indicators have turned strongly lower after approaching overbought territory, but remain above their mid-lines, whilst the price has failed to sustain gains above its 200 EMA, currently around 1.5550. A break below the mentioned Fibonacci support should signal a downward continuation for Tuesday towards the 1.5380/90 region.
Support levels: 1.5475 1.5430 1.5385
Resistance levels: 1.5520 1.5560 1.5590
USD/JPY Current price: 123.43
View Live Chart for the USD/JPY
The USD/JPY pair surged to a fresh 2-week high of 123.52 on the back of soaring stocks worldwide, after the announcement of a Greek agreement, having spent most of the last two sessions consolidating around that high. The Japanese yen was on demand at the weekly opening, when a deal between the country and its creditors was not yet achieved. Despite the lack of follow through, the upside is still favored as in the 1 hour chart, the technical indicators have resumed their advance in overbought territory after a limited upward corrective movement, whilst the price stands well above its moving averages. In the 4 hours chart, the technical indicators are also in extreme levels, losing their upward strength, but far from suggesting the rally may reverse during the upcoming hours. The immediate resistance level stands at 123.72, early July highs, with a break above it favoring and advance up to 124.50.
Support levels: 123.30 122.90 122.45
Resistance levels: 123.00 124.10 124.50
AUD/USD Current price: 0.7408
View Live Chart for the AUD/USD
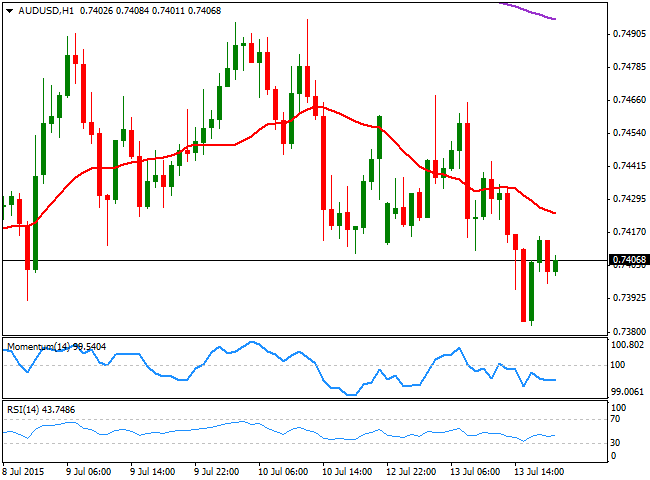
The Australian dollar remained under pressure, with the AUD/USD falling down to 0.7382 intraday, before recovering a few pips above the 0.7400 figure. The pair has posted a lower high and a lower low daily basis, a clear signal that the bearish trend remains firm in place. The short term picture favors an extension to fresh lows, as in the 1 hour chart, the price is developing below a bearish 20 SMA, whilst the technical indicators stand below their mid-lines, albeit lacking directional strength at the time being. In the 4 hours chart, the20 SMA heads slightly lower around 0.7440, acting as an immediate dynamic resistance, whilst the technical indicators have turned higher below their mid-lines. Investors are taking spikes up to the 0.7500 region as selling opportunities, which means a steady advance beyond such level is required to see the bearish pressure easing, at least temporarily.
Support levels: 0.7400 0.7370 0.7330
Resistance levels: 0.7450 0.7490 0.7530
Recommended Content
Editors’ Picks

EUR/USD stabilizes near 1.0550, looks to post weekly gains
EUR/USD continues to fluctuate in a tight channel at around 1.0550 in the American session on Friday as trading action remains subdued with US financial markets heading into the weekend early. The pair looks to end the week in positive territory.

GBP/USD loses traction, retreats below 1.2700
After climbing to its highest level in over two weeks at 1.2750, GBP/USD reverses direction and declines to the 1.2700 area on Friday. In the absence of fundamental drivers, investors refrain from taking large positions. Nevertheless, the pair looks to snap an eight-week losing streak.

Gold pulls away from daily highs, holds near $2,650
Gold retreats from the daily high it set above $2,660 but manages to stay afloat in positive territory at around $2,650, with the benchmark 10-year US Treasury bond yield losing more than 1% on the day. Despite Friday's rebound, XAU/USD is set to register losses for the week.

Bitcoin attempts for the $100K mark
Bitcoin (BTC) price extends its recovery and nears the $100K mark on Friday after facing a healthy correction this week. Ethereum (ETH) and Ripple (XRP) closed above their key resistance levels, indicating a rally in the upcoming days.

Eurozone PMI sounds the alarm about growth once more
The composite PMI dropped from 50 to 48.1, once more stressing growth concerns for the eurozone. Hard data has actually come in better than expected recently – so ahead of the December meeting, the ECB has to figure out whether this is the PMI crying wolf or whether it should take this signal seriously. We think it’s the latter.

Best Forex Brokers with Low Spreads
VERIFIED Low spreads are crucial for reducing trading costs. Explore top Forex brokers offering competitive spreads and high leverage. Compare options for EUR/USD, GBP/USD, USD/JPY, and Gold.
