EUR/USD Current price: 1.0991
View Live Chart for the EUR/USD
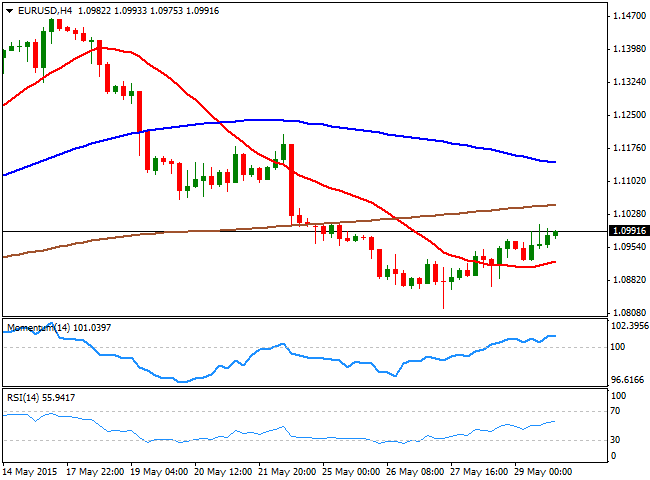
The EUR/USD pair closed last week flat right below the 1.1000 level, having erased all of its early week gains. The pair may gap higher at the opening in this first day of June, as news over the weekend should build up investors' confidence in the common currency. The good news are coming from Greece , as the economy minister Stathakis said that the country will pay its June 5th IMF maturity, whilst more important, The Interior minister Nikos Voutsis said on Saturday that some parts of the anti-austerity program could be pushed back by six months "or maybe a year," in order to reach a deal with its creditors as soon as this week. The comment would have been different if coming from Tsipras or Varoufakis, yet indeed it would a step in the right direction.
Technically, the 4 hours chart shows that the price ended last week with a positive note, trading above a mild bullish 20 SMA, with the RSI indicator heading north around 55 and the Momentum indicator consolidating in positive territory. Bigger time frames however, maintain bearish bias, which should keep the upside limited ahead of critical events later this week. The 1.1050 level is key for the upcoming sessions, as it a strong static resistance level, above which the pair can continue advancing.
Support levels: 1.0950 1.0900 1.0860
Resistance levels: 1.1000 1.1050 1.1090
EUR/JPY Current price: 136.45
View Live Chart for the EUR/JPY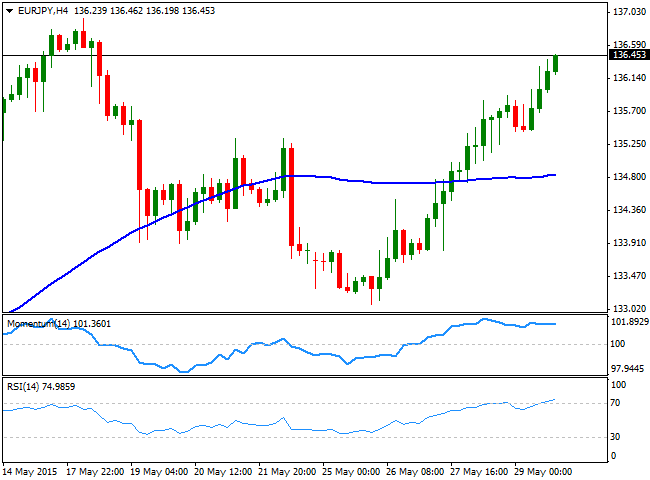
The EUR/JPY closed last week with a strong tone, near the 4-month high posted in May at 136.95. A weaker yen and renewed hopes on a Greek deal have backed the pair, although the 137.00 level stands as a major technical hurdle, as in there stands the 200 SMA in the daily chart, and the 100 SMA in the weekly, something that should attract some selling interest if reached. Shorter term, the 4 hours chart shows that the price has been steadily advancing above its moving averages, with the 200 SMA gaining strength well below the 100 SMA, reflecting bulls are losing steam. In the same chart, the Momentum indicator stands horizontal in positive territory, although the RSI heads higher around 74, maintaining the risk towards the upside, particularly if good news from Greece keep coming.
Support levels: 136.05 135.50 135.10
Resistance levels: 136.65 137.00 137.45
GBP/USD Current price: 1.5289
View Live Chart for the GBP/USD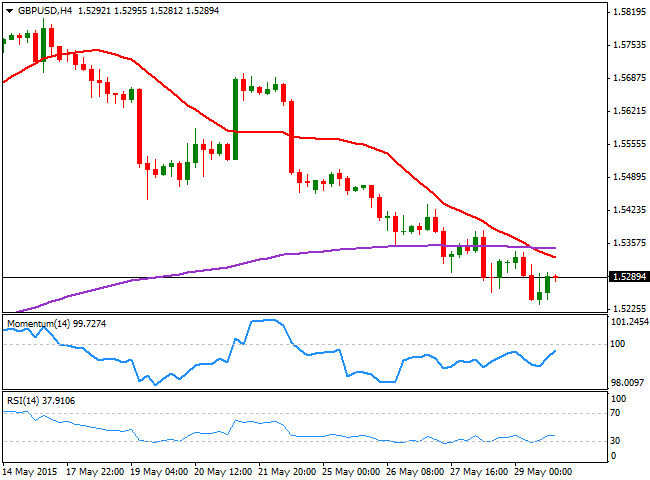
The GBP/USD pair closed the week below the 1.5300 level, unable to attract buyers, despite increasing optimism among investors. The pair has weakened sharply for a second week in a row, giving back all post-election gains and closing the month into the red. Tepid data, particularly a soft GDP revision of the first quarter growth, weighted on Pound, albeit the region continued to grow steadily according to PMI figures. Nevertheless, the technical picture continues to favor the downside, as the 4 hours chart shows that the price stands below its 200 EMA, whilst the 20 SMA maintains is bearish slope after crossing below it, now offering dynamic resistance in the around 1.5330. In the same chart the RSI indicator has corrected oversold readings, but lost upward potential below its mid-line, whilst the RSI aims higher, but remains below the 100 level. A strong static mid-term support stands at 1.5260, which means that renewed selling pressure below it, should signal a steady downward continuation for this Monday.
Support levels: 1.5260 1.5220 1.5180
Resistance levels: 1.5330 1.5365 1.5400
USD/JPY Current price: 124.14
View Live Chart for the USD/JPY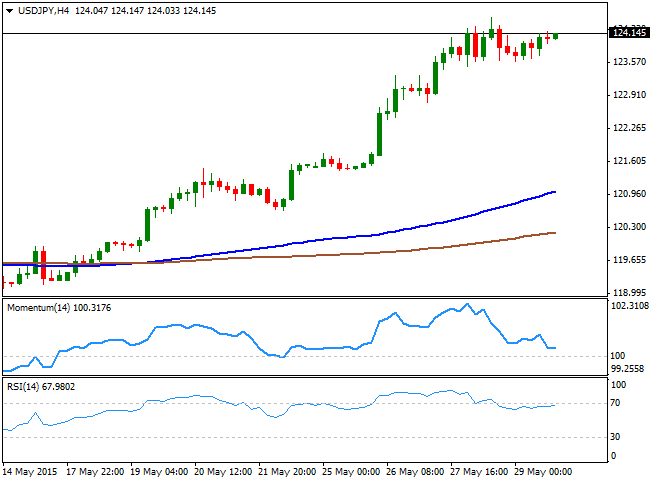
The USD/JPY pair broke above its 2007 high this week, advancing up to 124.45 and holding above the 124.00 figure, following a technical breakout. The pair has been trapped in a tight range for almost two months, finally advancing after FED's chair Yellen reaffirmed her commitment to rise US rates this year, increasing the imbalance between both Central Banks. The technical picture is bullish according to the daily chart, with the price advancing sharply above its 100 SMA and the technical indicators maintaining a strong bullish tone, despite being in extreme overbought levels. However, the 4 hours chart shows that the Momentum indicator diverges sharply lower and approaches its mid-line, whilst the RSI indicator hovers around 67, showing no directional strength. In this last chart, the price is far above its moving averages that have now become insignificant for intraday traders. The market has been targeting the 125.00 level ever since the year become, which means the level will be critical, as if reached, the market may finally profit and therefore trigger a strong downward correction.
Support levels: 124.00 123.65 123.30
Resistance levels: 124.45 124.85 125.10
AUD/USD Current price: 0.7643
View Live Chart for the AUD/USD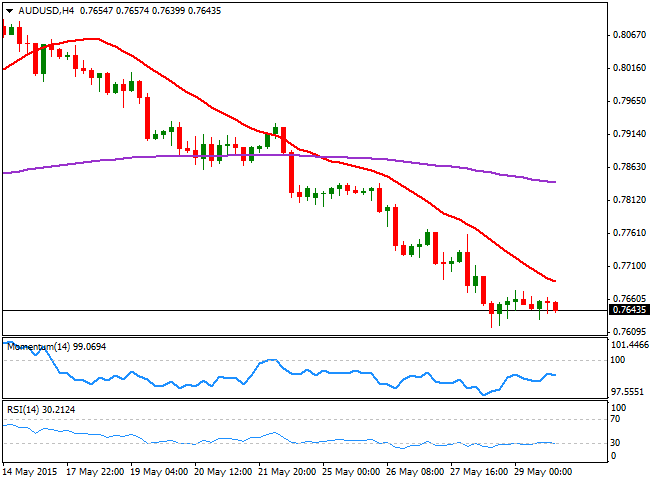
The Australian dollar fell down to 0.7617 against the greenback, closing the month with losses as the pair as resumed its decline on the back of renewed hopes the FED will raise its main benchmark over the upcoming months. The pair may extend its decline this week, as a Chinese think-thank released over the weekend suggest the country's slowing growth may extend during the second half of this 2015. China has cut its interest rates five times in six months and announced tax benefits to boost local sluggish growth, and additional easing is on the table. Since China is one of the bigger Australian's commercial partner, the AUD tends to suffer with Chinese bad news. Technically, the AUD/USD 4 hours chart shows that the price remains well below a strongly bearish 20 SMA, currently around 0.7690, whilst the technical indicators present a mild bearish tone in negative territory, with the RSI in oversold territory. The monthly low stands at 0.7617, which means a break below it should fuel the decline towards the 0.7530 price zone, the next strong static support area.
Support levels: 0.7615 0.7580 0.7530
Resistance levels: 0.7655 0.7690 0.7730
Recommended Content
Editors’ Picks

EUR/USD stabilizes near 1.0550 despite soft German inflation data
EUR/USD fluctuates in a narrow range near 1.0550 in the American session on Thursday. Soft inflation data from Germany makes it difficult for the Euro to gather strength, limiting the pair's upside, while US markets remain closed in observance of the Thanksgiving Day holiday.

GBP/USD trades below 1.2700 on modest USD recovery
GBP/USD struggles to gain traction and moves sideways below 1.2700 on Thursday. The US Dollar corrects higher following Wednesday's sharp decline, not allowing the pair to gain traction. The market action is likely to remain subdued in the American session.

Gold maintains shallow recovery on Fed rate-cut bets
Gold extends its shallow recovery from Tuesday’s lows as it trades in the $2,640s on Thursday. The yellow metal is seeing gains on the back of cementing market bets that the Fed will go ahead and cut US interest rates at its December meeting.

Fantom bulls eye yearly high as BTC rebounds
Fantom (FTM) continued its rally and rallied 8% until Thursday, trading above $1.09 after 43% gains in the previous week. Like FTM, most altcoins have continued the rally as Bitcoin (BTC) recovers from its recent pullback this week.

Eurozone PMI sounds the alarm about growth once more
The composite PMI dropped from 50 to 48.1, once more stressing growth concerns for the eurozone. Hard data has actually come in better than expected recently – so ahead of the December meeting, the ECB has to figure out whether this is the PMI crying wolf or whether it should take this signal seriously. We think it’s the latter.

Best Forex Brokers with Low Spreads
VERIFIED Low spreads are crucial for reducing trading costs. Explore top Forex brokers offering competitive spreads and high leverage. Compare options for EUR/USD, GBP/USD, USD/JPY, and Gold.