GBP/JPY Price Forecast: Sellers eye break below 100-day SMA
- GBP/JPY tests 100-day SMA as Yen momentum improves.
- RSI near 42 signals sellers retain near-term control.
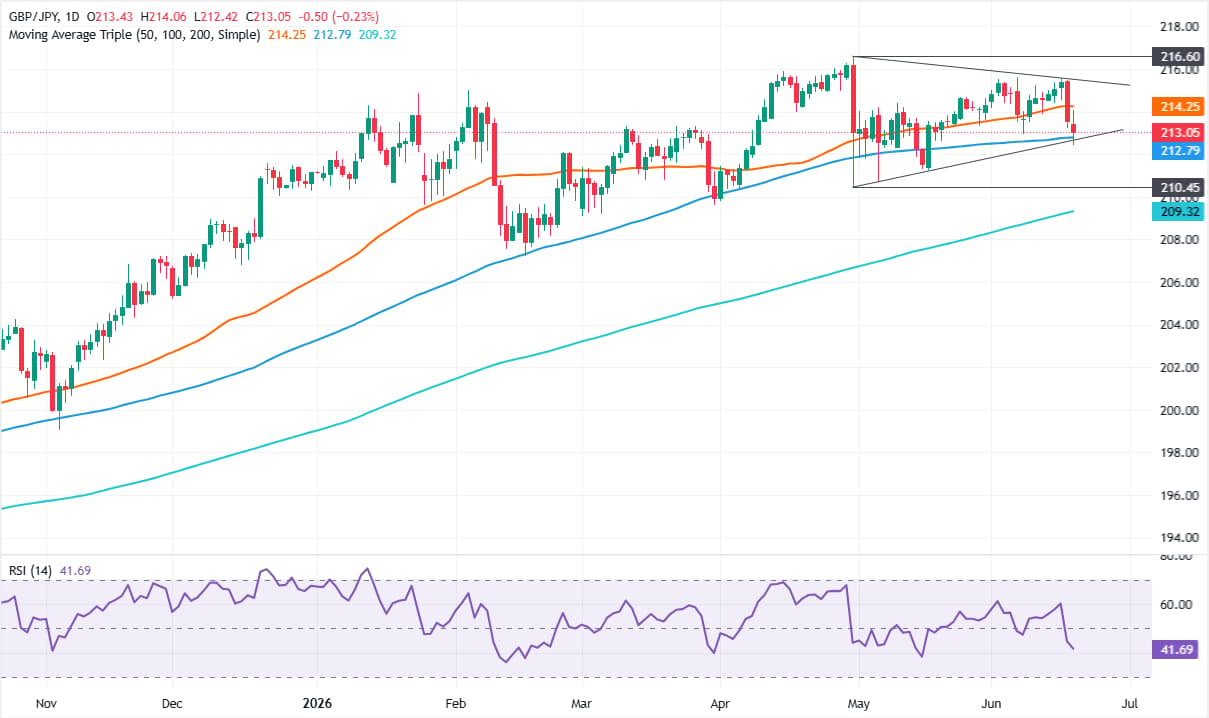
- Break below 212.79 exposes 211.26 and 210.45 supports.

The GBP/JPY retreats during the North American session on Thursday, down 0.21% as the Pound Sterling depreciates, despite the Bank of England (BoE) holding rates unchanged. At the time of writing, the cross-pair trades at 213.11 after peaking near 214.06.
GBP/JPY Price Forecast: Technical outlook
From a price action perspective, the GBP/JPY is neutral-biased, though over the last couple of trading days, the Yen has shown signs of life, driving the cross-pair to test key support at the 100-day Simple Moving Average (SMA) at 212.79.
The Relative Strength Index (RSI) shows that momentum favors further downside, with the index aiming lower, at 41.68. Hence, the GBP/JPY might continue to edge lower.
If GBP/JPY clears decisively the 199-day SMA, the next support would be the May 18 daily low of 211.26. Below sits the April 30 swing low of 210.45, before the cross aims toward the 200-day SMA at 209.32.
On the other hand, GBP/JPY must clear the 50-day SMA at 214.25 to allow buyers to challenge the 215.00 milestone. Up next, the area of interest is the 216.00 mark.
GBP/JPY Price Chart – Daily
Japanese Yen Price This week
The table below shows the percentage change of Japanese Yen (JPY) against listed major currencies this week. Japanese Yen was the strongest against the British Pound.
| USD | EUR | GBP | JPY | CAD | AUD | NZD | CHF | |
|---|---|---|---|---|---|---|---|---|
| USD | 1.01% | 1.58% | 0.74% | 1.03% | 0.40% | 1.26% | 1.02% | |
| EUR | -1.01% | 0.53% | -0.24% | 0.00% | -0.63% | 0.25% | 0.00% | |
| GBP | -1.58% | -0.53% | -0.96% | -0.51% | -1.16% | -0.27% | -0.52% | |
| JPY | -0.74% | 0.24% | 0.96% | 0.27% | -0.35% | 0.55% | 0.26% | |
| CAD | -1.03% | -0.01% | 0.51% | -0.27% | -0.66% | 0.29% | -0.01% | |
| AUD | -0.40% | 0.63% | 1.16% | 0.35% | 0.66% | 0.89% | 0.64% | |
| NZD | -1.26% | -0.25% | 0.27% | -0.55% | -0.29% | -0.89% | -0.25% | |
| CHF | -1.02% | -0.00% | 0.52% | -0.26% | 0.00% | -0.64% | 0.25% |
The heat map shows percentage changes of major currencies against each other. The base currency is picked from the left column, while the quote currency is picked from the top row. For example, if you pick the Japanese Yen from the left column and move along the horizontal line to the US Dollar, the percentage change displayed in the box will represent JPY (base)/USD (quote).
Author

Christian Borjon Valencia
FXStreet
Markets analyst, news editor, and trading instructor with over 14 years of experience across FX, commodities, US equity indices, and global macro markets.