Markets adored the CPI report because it looks like the return of disinflationary progress
|
Outlook
Markets adored the CPI report because it looks like the return of disinflationary progress. Reuters reports “Two quarter-point Fed rate cuts are back in the futures strip for this year, with a first move almost fully priced by September and even a one-in-three chance now that the Fed may cut as soon as July.”
Well, no. The improvement we have is very, very small, it’s for only one month after three of disappointment, and it’s not even the data the Fed cares about.
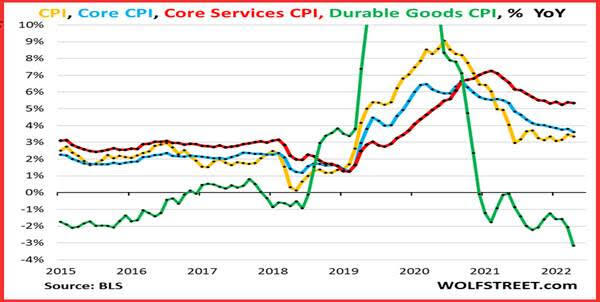
The secret ingredient was a gigantic drop in durable goods that more than offset the steady but still too high rise in core services, which are 59% of the index. See the chart from WolfStreet.
Here’s another bummer—core CPI monthly on the annualized basis is 3.6%. The three-month core CPIrose by 4.1% annualized. Both of these measures are slightly better than the months before, but not by much. And the six-month core CPI accelerated to 4.0% annualized, the biggest rise since July, for the 5th month in a row of increases. A bright spot—rent and owners’ equivalent both fell, although Case Shiller and Zillow disagree on those, respectively.
Bottom line, we were right about inflation data carrying some unhappy surprises, but as usual, markets like simplicity and the top numbers are indeed better. The market ignored them because traders were just not in the mood, aka sentiment.
It seems that the only folks who saw negatives in the inflation report were Feds. Minneapolis Fed Kashkari and Chicago Fed Goolsbee each said “nice data, not yet.” We get another bevvy of Fed speakers today. Cleveland Fed Mester said “holding rates steady is still appropriate for now.”
The only financial press report that downplays yesterday’s data is an opinion piece in the FT (“Unhedged” by Armstrong). He writes “Yes, two-year Treasury yields fell a respectable if hardly giddy 9 basis points; equities rose by more than a per cent. But what did not change much was the market’s expectations for interest rate cuts. Yesterday, the futures market expected 43bp of cuts by December. Today? 52bp. Meh.”
Should we not dither about the other measurements—monthly and other timeframes annualized? No, if we want to predict market response. Yes, if we want to get the economics right, which implies a better long-term understanding of the Fed and then the market response. The goal is not to be right—it’s to make a gain or at least avoid a loss. Recall that the last time we got the PCE data, everyone pointed out that if you subtract shelter, US inflation is about the same as in the eurozone. But the Fed does not subtract shelter.
In the eurozone, Italy reported inflation falling under 1%. Yowza. The combined inflation rate is only about 2.4% and confidence is high that the ECB will cut in June, and the BoE, too, maybe. The ECB meeting is scheduled for June 6, a mere three weeks away. When do traders start punishing the euro?
Bloomberg’s usual too-cute shorthand comes up with this gem: “US April CPI could have been much worse, so stocks rallied to all-time highs; It also could have been much better, so treat the rally with caution.”
Forecast: The FX market overreacted to the CPI release with some of the biggest single-day moves year-to-date. A lot of the move has to do with an overall sense of risk-on rather than anything specific in the data, and as noted, traders went out of their way to ignore inconvenient sectors and components.
Such a big move is not likely to slump and/or reverse right away, but as rates cuts in Europe and maybe the UK come closer, we must expect a pushback, if not before the euro in particular gets to the 62% retracement line on the daily chart at 1.0934. We nearly always get a fallback around there and several currencies have already breached that line.
Nobody looks at weekly charts very often, but check out the euro in that format. A 50% retracement would take the euro to 1.0404. Hmm.
This is an excerpt from “The Rockefeller Morning Briefing,” which is far larger (about 10 pages). The Briefing has been published every day for over 25 years and represents experienced analysis and insight. The report offers deep background and is not intended to guide FX trading. Rockefeller produces other reports (in spot and futures) for trading purposes.
To get a two-week trial of the full reports plus traders advice for only $3.95. Click here!
Information on these pages contains forward-looking statements that involve risks and uncertainties. Markets and instruments profiled on this page are for informational purposes only and should not in any way come across as a recommendation to buy or sell in these assets. You should do your own thorough research before making any investment decisions. FXStreet does not in any way guarantee that this information is free from mistakes, errors, or material misstatements. It also does not guarantee that this information is of a timely nature. Investing in Open Markets involves a great deal of risk, including the loss of all or a portion of your investment, as well as emotional distress. All risks, losses and costs associated with investing, including total loss of principal, are your responsibility. The views and opinions expressed in this article are those of the authors and do not necessarily reflect the official policy or position of FXStreet nor its advertisers.
