![]() Ming Jong Tey
Ming Jong Tey
Independent Analyst
Last Friday the US 10 year treasury yield (TNX) spiked to 1.60, the highest since July 2021.
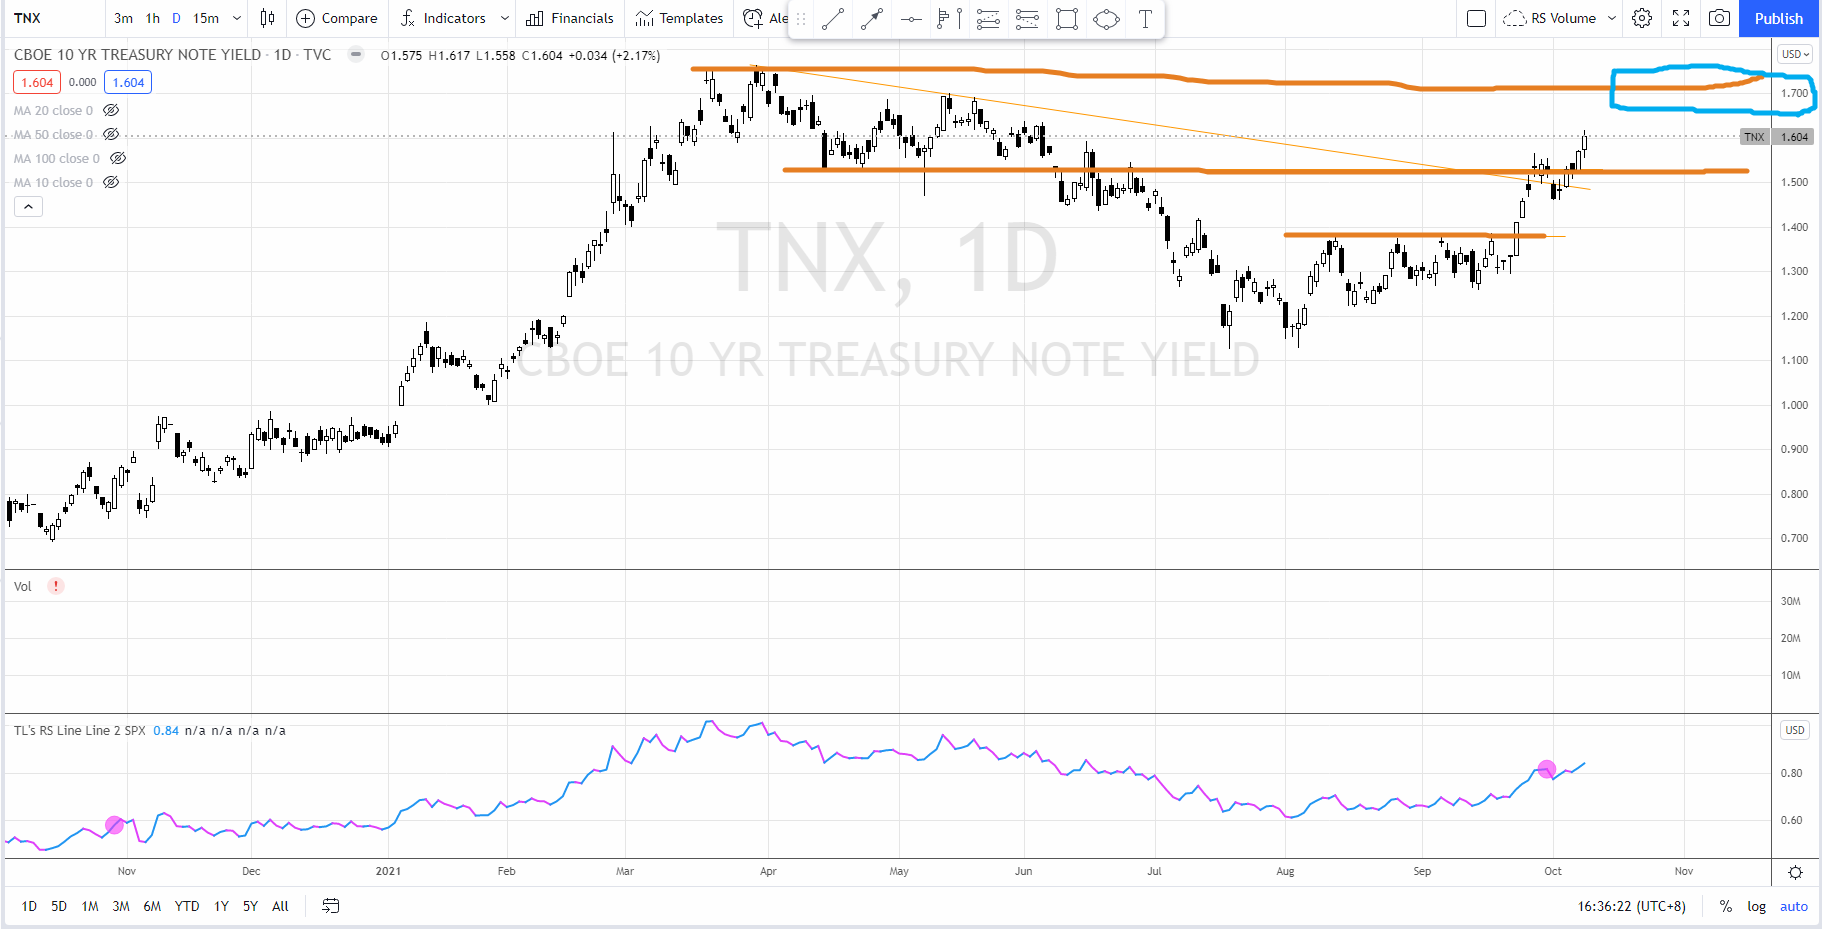
Based the daily chart above, TNX broke out from the Wyckoff accumulation structure 2 weeks ago and tested the axis line (where the support-turned-resistance) at 1.5 followed by a shallow reaction.
Last week, TNX was on the move again and broke the swing high resistance at 1.5 and close at the recent high at 1.60. It is likely to test the previous swing high formed in March 2021 at 1.7 (as shown in the blue box).
While the 10 year yield is on the rise, how does it affect the stock market? Let’s look at the NASDAQ 100 futures (NQ).
NASDAQ 100 Futures (NQ)
Firstly, why look at NASDAQ? While the 10 year yield (TNX) is rising, NASDAQ (plus other growth stocks) is generally under pressure as they tend to have an inversely proportional relationship.
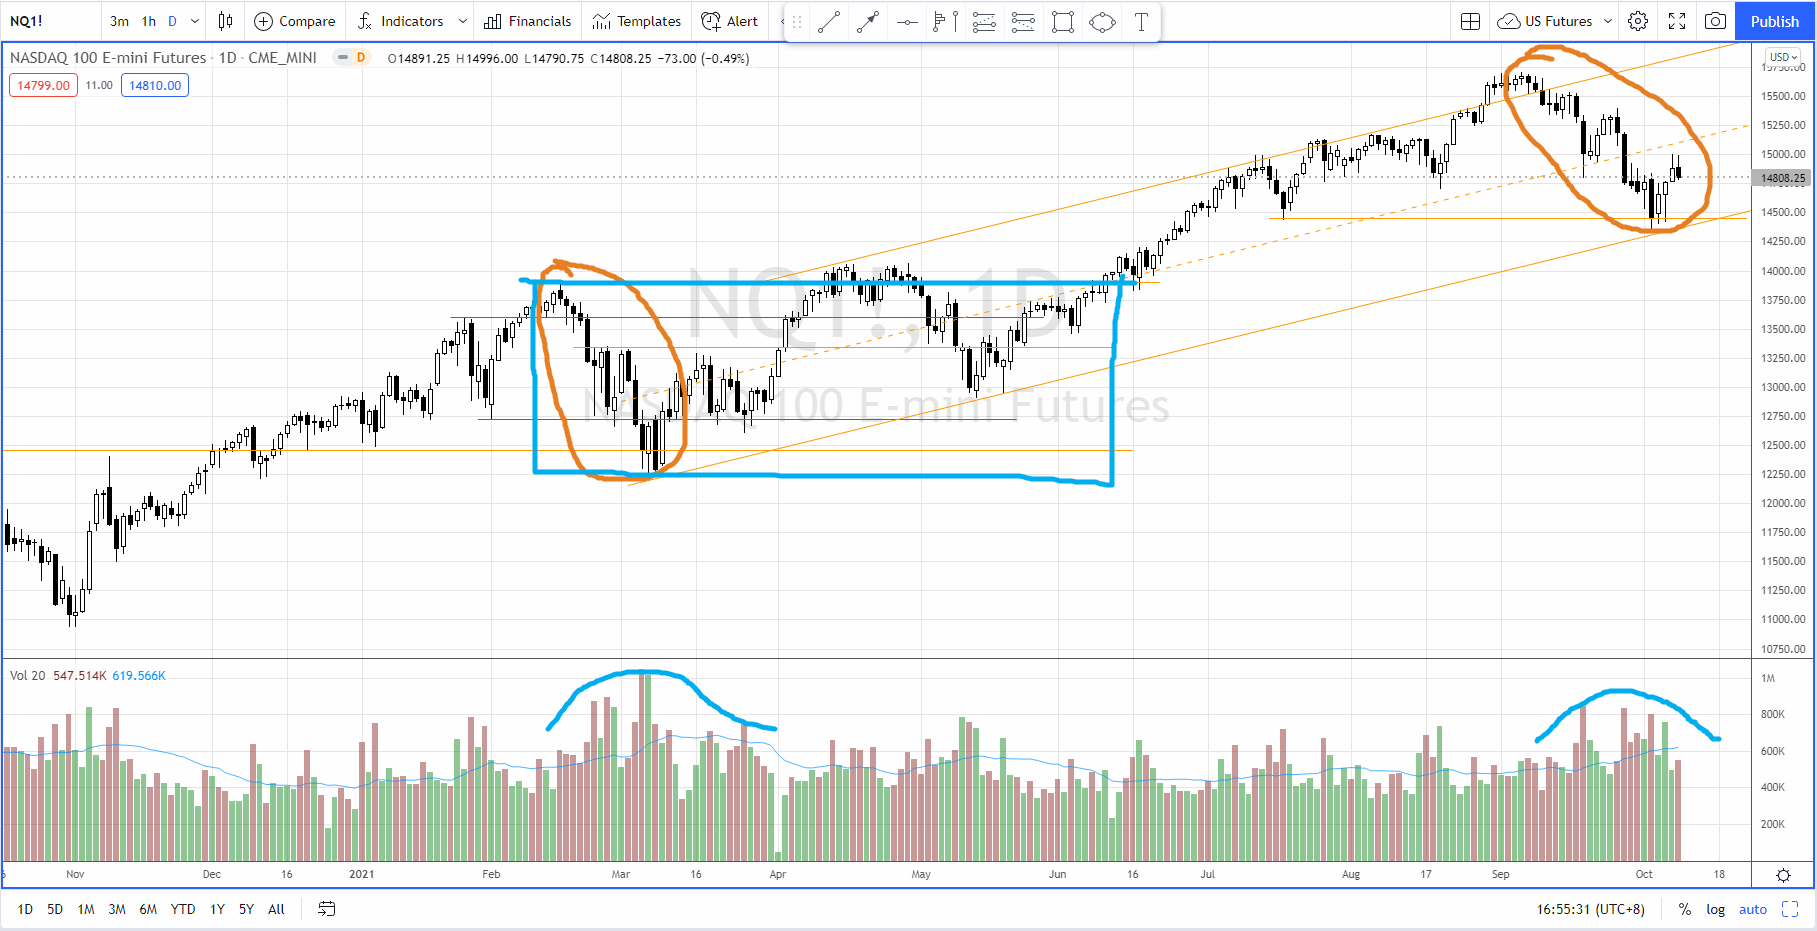
As shown in the daily chart above, Nasdaq is still in a very well defined long term up channel since Mar 2021. So long term trend is still up.
The down wave started in 20 Sep coincided with the breakout of the 10 year treasury yield (TNX) confirmed the inversely proportional relationship between Nasdaq and the TNX.
The characteristics of the the current down wave (which is still unfolding) is similar to the one in Feb 2021 while the supply level is slightly lower (as circled in orange). Last Wednesday (6 Oct) the bull finally showed some serious action which is reflected in the hammer price action and the spike of the demand. This is further confirmed on the next two days.
The bull is now given a chance to rally up to at least testing the supply zone at 15000–15200. We need to judge the quality of the coming rally. If the bull can take over from here on, we can expect a potential re-accumulation range like Feb-Jun 2021 (as boxed up in blue).
Instead of having a market crash, a re-accumulation is what I anticipate while the rotation is on-going to benefit the small cap (Russell 2000) as I mentioned in the past 3 weeks.
Let’s pay close attention to the characteristics of the price action (with the volume) in the coming week and to trade accordingly. Meanwhile, we can focus on the Financial ETF as the 10 year yield is rising because there are quite a number of the stocks in a great position to start the markup phase.
Meanwhile, there are still plenty of trading opportunities in the stock market. Watch the video below to find out how to trade the reversal and breakout with high confidence level.
Note: All information on this page is subject to change. The use of this website constitutes acceptance of our user agreement. Please read our privacy policy and legal disclaimer. Opinions expressed at FXstreet.com are those of the individual authors and do not necessarily represent the opinion of FXstreet.com or its management. Risk Disclosure: Trading foreign exchange on margin carries a high level of risk, and may not be suitable for all investors. The high degree of leverage can work against you as well as for you. Before deciding to invest in foreign exchange you should carefully consider your investment objectives, level of experience, and risk appetite. The possibility exists that you could sustain a loss of some or all of your initial investment and therefore you should not invest money that you cannot afford to lose. You should be aware of all the risks associated with foreign exchange trading, and seek advice from an independent financial advisor if you have any doubts.
Recommended Content
Editors’ Picks
AUD/USD corrects toward 0.6850, awaits US PCE Price Index
AUD/USD is falling back toward 0.6850 in Friday's Asian trading, reversing from near 19-month peak. A tepid US Dollar bounce drags the pair lower but the downside appears called by the latest Chinese stimulus measures, which boost risk sentiment ahead of US PCE data.

USD/JPY pares gains toward 145.00 after Tokyo CPI inflation data
USD/JPY is paring back gains to head toward 145.00 in the Asian session on Friday, as Tokyo CPI inflation data keep hopes of BoJ rate hikes alive. However, intensifying risk flows on China's policy optimism support the pair's renewed upside. The focus shifts to the US PCE inflation data.

Gold price consolidates below record high as traders await US PCE Price Index
Gold price climbed to a fresh all-time peak on Thursday amid dovish Fed expectations. The USD languished near the YTD low and shrugged off Thursday’s upbeat US data. The upbeat market mood caps the XAU/USD ahead of the key US PCE Price Index.

Avalanche rallies following launch of incentive program for developers
Avalanche announced the launch of Retro9000 on Thursday as part of its larger Avalanche9000 upgrade. Retro9000 is a program designed to support developers with up to $40 million in grants for building on the Avalanche testnet.

RBA widely expected to keep key interest rate unchanged amid persisting price pressures
The Reserve Bank of Australia is likely to continue bucking the trend adopted by major central banks of the dovish policy pivot, opting to maintain the policy for the seventh consecutive meeting on Tuesday.

Five best Forex brokers in 2024
VERIFIED Choosing the best Forex broker in 2024 requires careful consideration of certain essential factors. With the wide array of options available, it is crucial to find a broker that aligns with your trading style, experience level, and financial goals.