WTI Price Analysis: Bearish Doji probes Oil buyers around $78.50
|
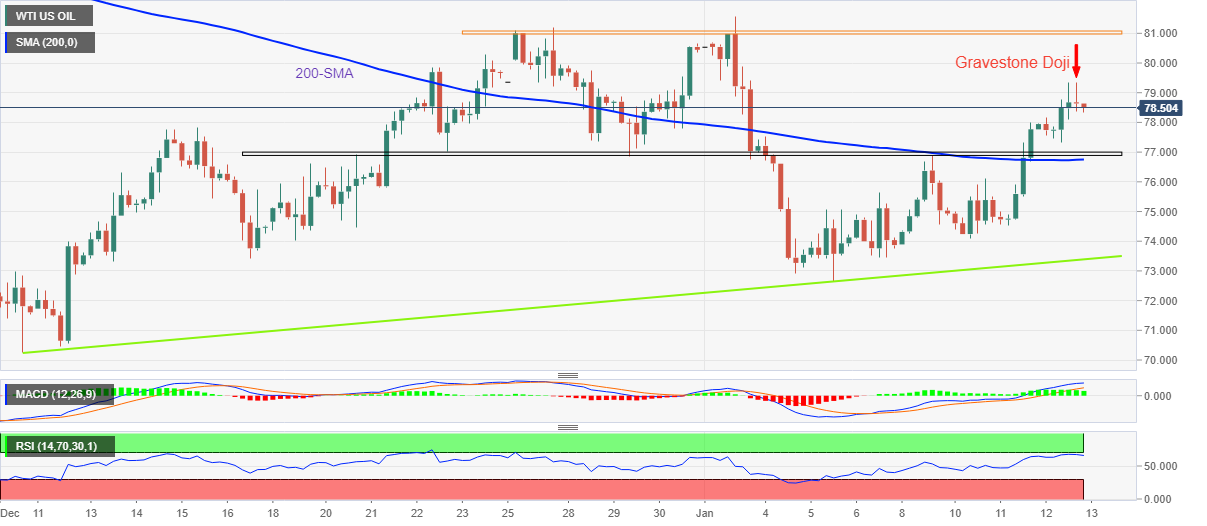
- WTI struggles to extend four-day uptrend around weekly top.
- Gravestone Doji joins overbought RSI to probe energy bulls.
- Three-week-old horizontal support zone, 200-SMA challenge bears.
- Bulls could aim for $81.10 during further upside.
WTI crude oil seesaws around $78.50 as energy bulls take a breather after a four-day winning streak. That said, the black gold’s latest weakness, or inability to rise further, could be linked to a bearish candlestick formation on the four-hour chart, as well as the overbought RSI (14).
That said, the Gravestone Doji candlestick at the weekly top teases WTI sellers to revisit the $77.00-76.90 support zone comprising multiple lows marked since December 20. However, the 200-SMA level surrounding $76.75 could challenge the commodity’s further downside.
In a case where the quote remains bearish past $76.75, multiple hurdles around $75.00 could test the oil bears before highlighting an upward-sloping support line from December 09, close to $73.35 at the latest.
Alternatively, WTI crude oil prices need to cross the immediate top of $79.35 to defy the downside bias posed by the bearish candlestick.
However, a three-week-old horizontal region surrounding $80.95-81.10 could challenge the oil buyers afterward.
It’s worth noting, however, that the WTI crude oil’s run-up beyond $81.10 will need validation from the monthly high surrounding $81.55 to aim for the previous month’s peak of $83.30.
To sum up, WTI crude oil is likely to witness a pullback but the bears have a bumpy road ahead before retaking control.
WTI: Four-hour chart
Trend: Pullback expected
Information on these pages contains forward-looking statements that involve risks and uncertainties. Markets and instruments profiled on this page are for informational purposes only and should not in any way come across as a recommendation to buy or sell in these assets. You should do your own thorough research before making any investment decisions. FXStreet does not in any way guarantee that this information is free from mistakes, errors, or material misstatements. It also does not guarantee that this information is of a timely nature. Investing in Open Markets involves a great deal of risk, including the loss of all or a portion of your investment, as well as emotional distress. All risks, losses and costs associated with investing, including total loss of principal, are your responsibility. The views and opinions expressed in this article are those of the authors and do not necessarily reflect the official policy or position of FXStreet nor its advertisers.