USD/MXN rises above 18.1000 despite a soft USD
|
- The US JOLTs report showed a decrease of 632,000 job vacancies in February.
- Factory Orders in the US fell in February, caused by higher borrowing costs.
- Money market futures estimate a 57% chance of a pause in the Fed’s tightening cycle.
Despite the greenback’s weakness, the Mexican Peso (MXN) losses ground vs. the US Dollar (USD). Deterioration in market sentiment and worse-than-expected economic data from the United States (US) spurred capital outflows from emerging market economies. At the time of writing, the USD/MXN is trading at 18.1170, above its opening price by 0.34%.
USD/MXN climbs on risk-off mood
US equities remain to trade in negative territory, while US Treasury bond yields plunge. Data released by the US Department of Labor showed that job vacancies dropped by 632,000 to 9.9 million, as shown by February’s JOLTs report. At the same time, Factory Orders fell in February, dropping 0.7% MoM, slightly recovering from January’s 2.1% plunge.
Following the latest reports, investors increased their bets that the US Federal Reserve (Fed) will pause its tightening cycle. Money market futures estimate a 57% chance of a pause, compared to Monday’s 43% odds. The forecast for 25 bps lies at a 43% chance.
The US Dollar Index (DXY), a gauge that measures the performance of six currencies vs. the American Dollar (USD), drops 0.44% and sits at 101.591, sponsored by falling US Treasury bond yields. The US bond yields plunge was spurred by traders repricing a less aggressive Federal Reserve.
An absent Mexican economic docket left USD/MXN traders adrift to sentiment and US Dollar dynamics. Bad news for the US economy is beginning to weigh on the greenback, with investors shifting towards growth as inflation cools.
USD/MXN Technical analysis
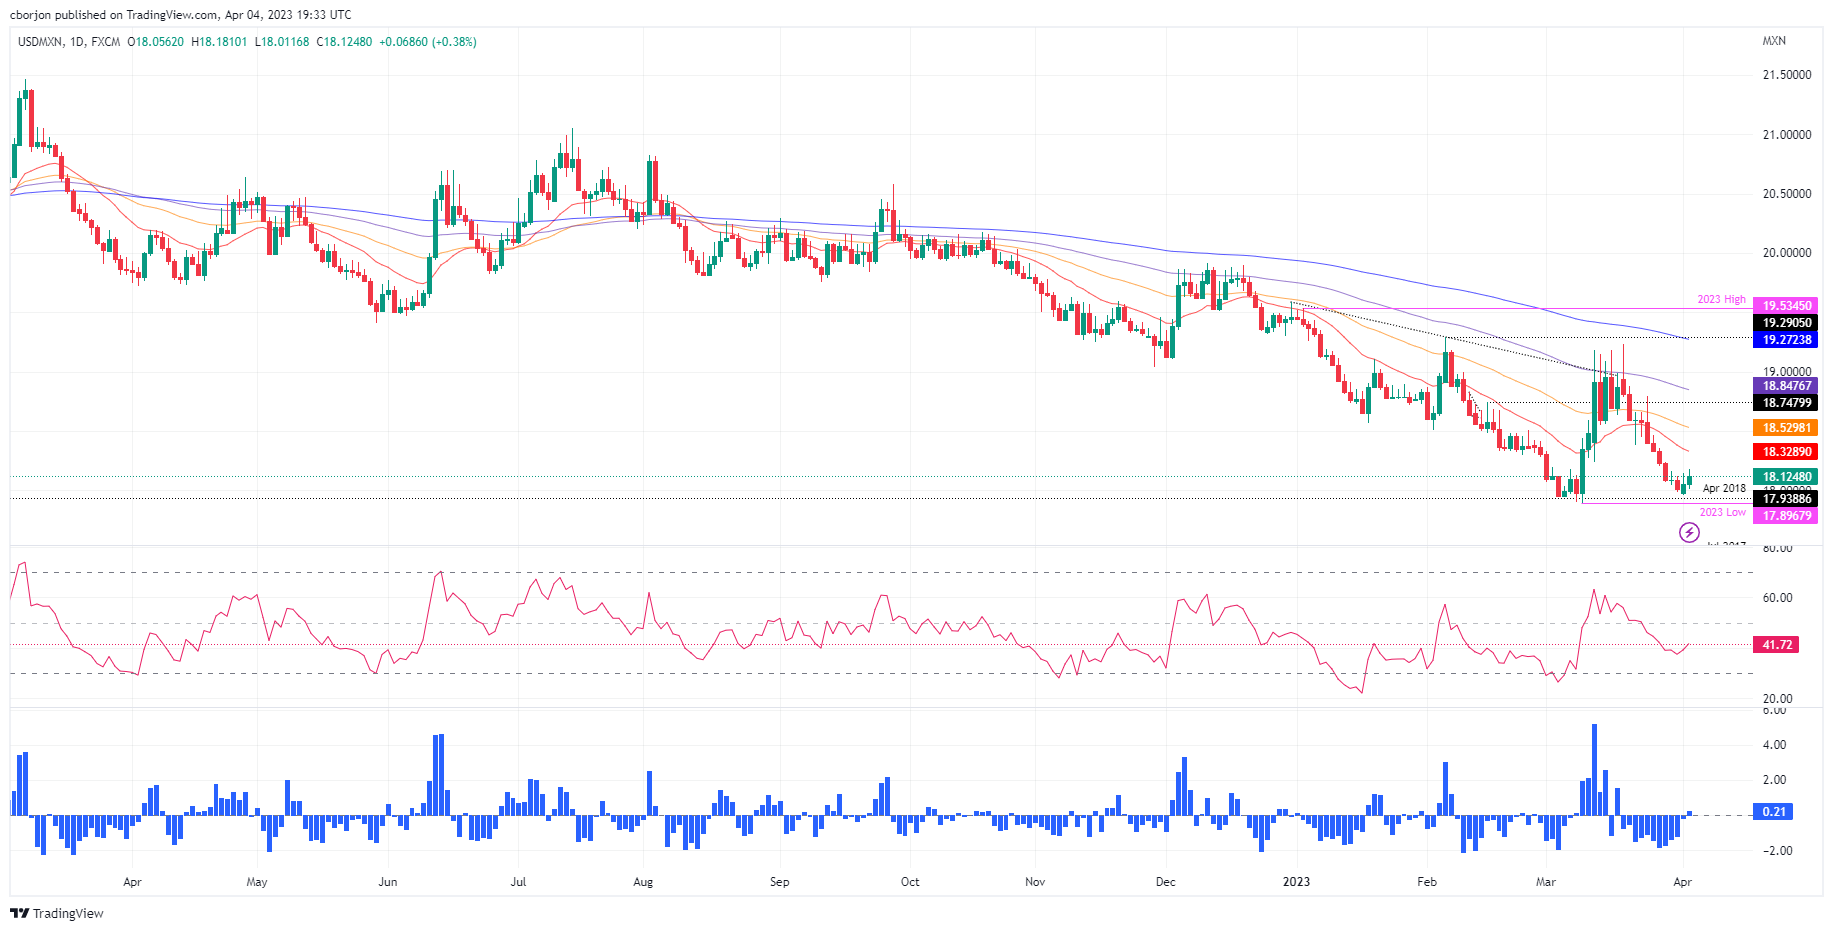
The USD/MXN appears to have bottomed at around the weekly low of 17.9644, reached on Monday. A double bottom emerged though the USD/MXN needs to reclaim the 20, 50, and 100-day EMAs in the near term, so the chart pattern could remain in play. Therefore, if the USD/MXN cracks the 100-day EMA at 18.8477, that could open the door for further upside. That said, the USD/MXN next resistance would be the 19.0000 figure, followed by the March 20 high at 19.2327 and the February 6 high at 19.2905, before aiming towards the YTD high at 19.5345.
Information on these pages contains forward-looking statements that involve risks and uncertainties. Markets and instruments profiled on this page are for informational purposes only and should not in any way come across as a recommendation to buy or sell in these assets. You should do your own thorough research before making any investment decisions. FXStreet does not in any way guarantee that this information is free from mistakes, errors, or material misstatements. It also does not guarantee that this information is of a timely nature. Investing in Open Markets involves a great deal of risk, including the loss of all or a portion of your investment, as well as emotional distress. All risks, losses and costs associated with investing, including total loss of principal, are your responsibility. The views and opinions expressed in this article are those of the authors and do not necessarily reflect the official policy or position of FXStreet nor its advertisers.
