USD/MXN Price Analysis: RSI conditions prod Mexican Peso buyers around 17.53-54 region
|
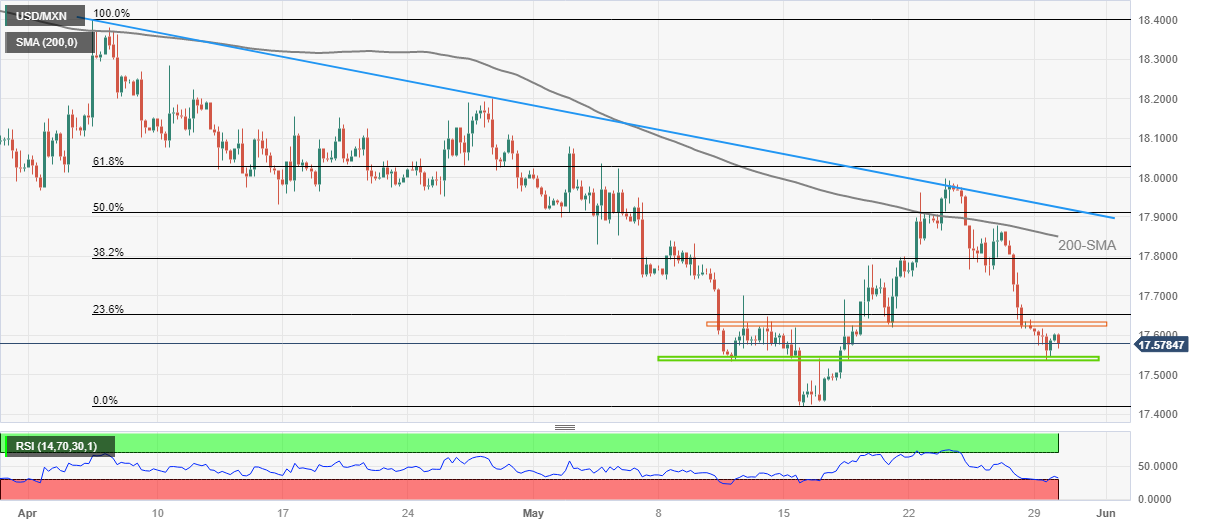
- USD/MXN takes offers to approach 13-day-old horizontal support zone, down for the third consecutive day.
- Oversold RSI (14) line challenges Mexican Peso pair’s further downside toward yearly bottom.
- 200-SMA, two-month-old descending resistance line check USD/MXN bulls before giving them control.
USD/MXN holds lower ground near the lowest levels in a fortnight, mildly offered around 17.57 during early Tuesday in Europe, as it prints a three-day losing streak.
In doing so, the Mexican Peso (MXN) pair approaches a short-term key horizontal support comprising multiple levels marked since May 11, around 17.53-54. Adding strength to the stated horizontal support is the RSI (14) line poking the oversold territory.
Should the USD/MXN pair remains bearish past 17.53, it can quickly prod the yearly low marked the last week around 17.42.
It’s worth noting that the quote’s sustained weakness past 17.42 makes it vulnerable to plunging towards the year 2016 bottom of around 17.05 and then to the 17.00 round figure.
Meanwhile, the USD/MXN pair’s expected recovery appears to have a limited upside room as the 17.62-63 zone, comprising multiple levels marked since May 11, guards the immediate rise.
Following that, the 200-SMA hurdle of 17.85 and a descending resistance line from early April, close to 17.92, can challenge the pair buyers ahead of directing them to the 18.00 round figure.
Overall, USD/MXN is likely to recover but the upside room appears limited.
USD/MXN: Four-hour chart
Trend: Limited downside expected
Information on these pages contains forward-looking statements that involve risks and uncertainties. Markets and instruments profiled on this page are for informational purposes only and should not in any way come across as a recommendation to buy or sell in these assets. You should do your own thorough research before making any investment decisions. FXStreet does not in any way guarantee that this information is free from mistakes, errors, or material misstatements. It also does not guarantee that this information is of a timely nature. Investing in Open Markets involves a great deal of risk, including the loss of all or a portion of your investment, as well as emotional distress. All risks, losses and costs associated with investing, including total loss of principal, are your responsibility. The views and opinions expressed in this article are those of the authors and do not necessarily reflect the official policy or position of FXStreet nor its advertisers.