USD/MXN Price Analysis: Plummets to six-year lows with sellers eyeing 17.50
|
- The strong downtrend in USD/MXN continues as emerging market currencies advance against the US Dollar.
- USD/MXN eyes 17.5000 support; bullish potential remains limited, with key resistance at 17.9492 and 18.2263.
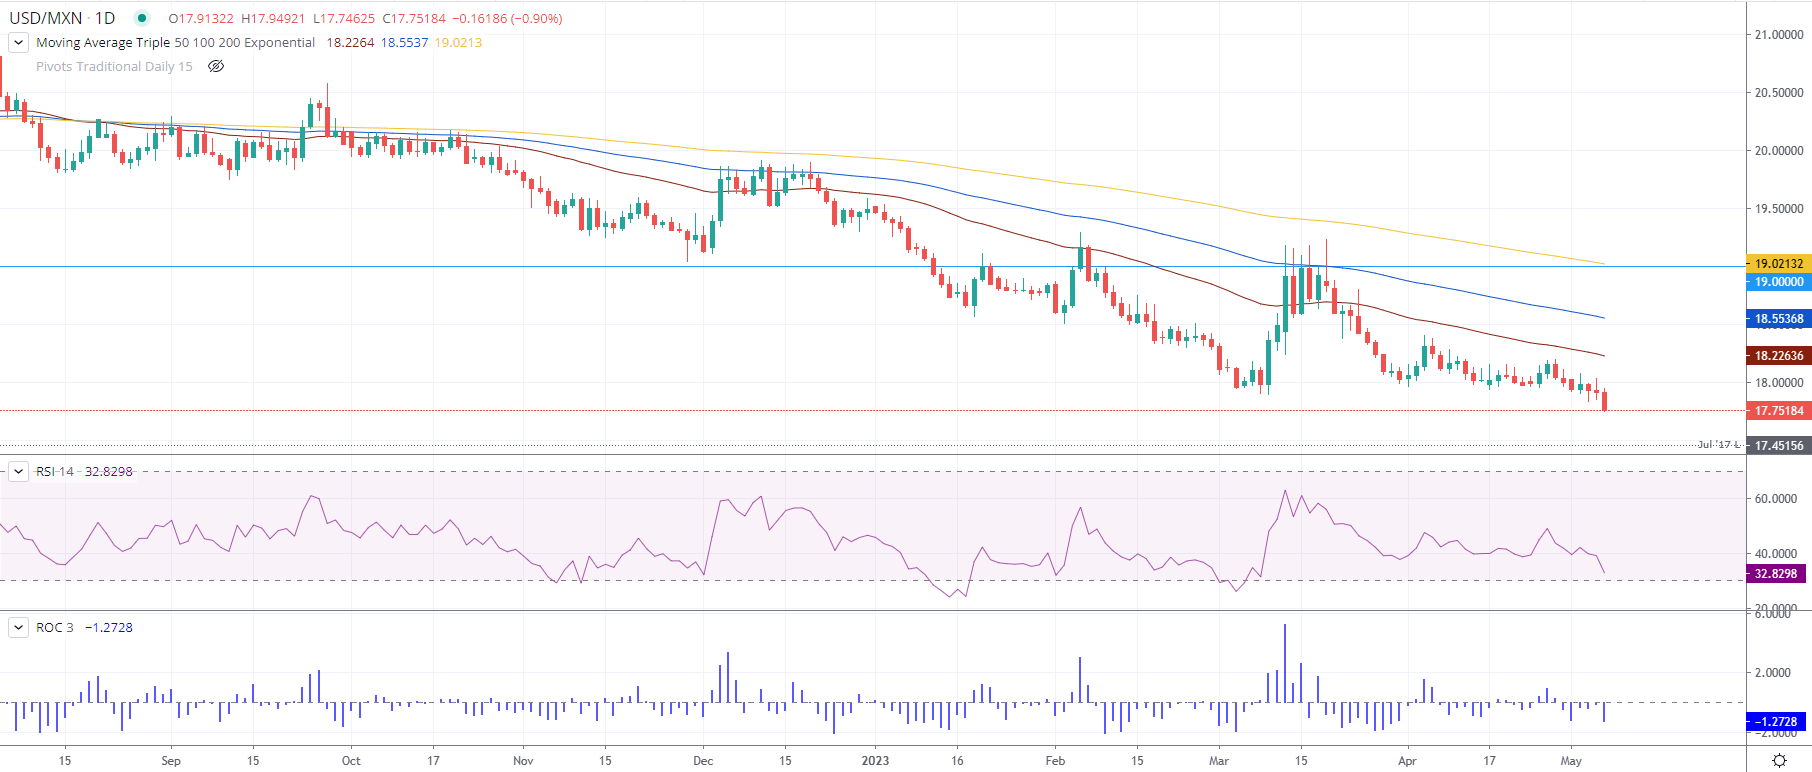
The USD/MXN fell to fresh six-year lows of 17.7462, hit in the middle of the New York session even though the US economy revealed upbeat data, which failed to strengthen the US Dollar (USD). At the time of writing, the USD/MXN pair is trading at 17.7480, down 0.92%.
A goodish employment report in the United States (US) improved market sentiment. Therefore, high beta currencies, alongside emerging markets peers, advanced sharply against their counterpart, the US Dollar.
USD/MXN Price Action
The USD/MXN pair remains in a strong downtrend, registering more than 9% losses from year-to-date (YTD). Notably, since the USD/MXN pair fell below the 19.00 figure, the USD/MXN has tested the level for ten days, though buyers could not crack it. In fact, traders remain short in the USD/MXN pair, even though speculations around the Bank of Mexico’s (Banxico) pausing its tightening cycle in May, have not triggered outflows from the emerging market currency.
Momentum indicators, like the Relative Strength Index (RSI), remain to push downwards, with space before turning oversold. The 3-day Rate of Change (RoC) shifted neutral and resumed to the downside as sellers stepped in. Therefore, the USD/MXN path of least resistance is downwards.
That said, the USD/MXN next support would be 17.5000. A breach of the latter will expose the July 2017 swing low of 17.4515 before dropping to 17.0000.
Conversely, if USD/MXN reclaims the May 5 daily high of 17.9492, that could form a bullish-engulfing candle pattern, which could warrant further upside. The buyer’s next stop would be 18.00, followed by the 50-day Exponential Moving Average (EMA) at 18.2263.
USD/MXN Daily Chart
Information on these pages contains forward-looking statements that involve risks and uncertainties. Markets and instruments profiled on this page are for informational purposes only and should not in any way come across as a recommendation to buy or sell in these assets. You should do your own thorough research before making any investment decisions. FXStreet does not in any way guarantee that this information is free from mistakes, errors, or material misstatements. It also does not guarantee that this information is of a timely nature. Investing in Open Markets involves a great deal of risk, including the loss of all or a portion of your investment, as well as emotional distress. All risks, losses and costs associated with investing, including total loss of principal, are your responsibility. The views and opinions expressed in this article are those of the authors and do not necessarily reflect the official policy or position of FXStreet nor its advertisers.
