USD/MXN Price Analysis: Mexican Peso sellers take a breather below 18.00 resistance
|
- USD/MXN snaps five-day uptrend by printing mild losses at two-week high.
- Upbeat oscillators, sustained break of 21-DMA favor Mexican Peso sellers.
- Seven-week-old descending trend line guards immediate upside ahead of the key DMAs.
USD/MXN bulls ease control after a five-day uptrend as the Mexican Peso (MXN) pair retreats from a 13-day-high to 17.89 amid early Tuesday.
Even so, the USD/MXN buyers remain hopeful amid a successful break of the 21-DMA, around 17.80 by the press time. Adding strength to the upside bias for the pair are the bullish MACD signals and the firmer RSI (14) line.
As a result, the USD/MXN bulls keep the reins despite the latest retreat. However, the buyers need conviction from a downward-sloping resistance line from early April, close to 18.00, to convince the pair buyers.
Following that, the 50-DMA and 100-DMA, respectively near 18.10 and 18.35, could test the USD/MXN bulls before giving them control. Above all, a downward-sloping resistance line from December 2022, close to 18.75 at the latest, becomes the key hurdle for the pair to cross to aim for the highs marked in March and February, close to 19.25 and 19.30.
On the flip side, a daily closing below the 21-DMA support of 17.80 could recall the Mexican Peso buyers who target 17.50 support.
Should the USD/MXN remains bearish past 17.50, the yearly low marked during mid-May around 17.40 can act as the last defense of the Mexican Peso sellers.
USD/MXN: Daily chart
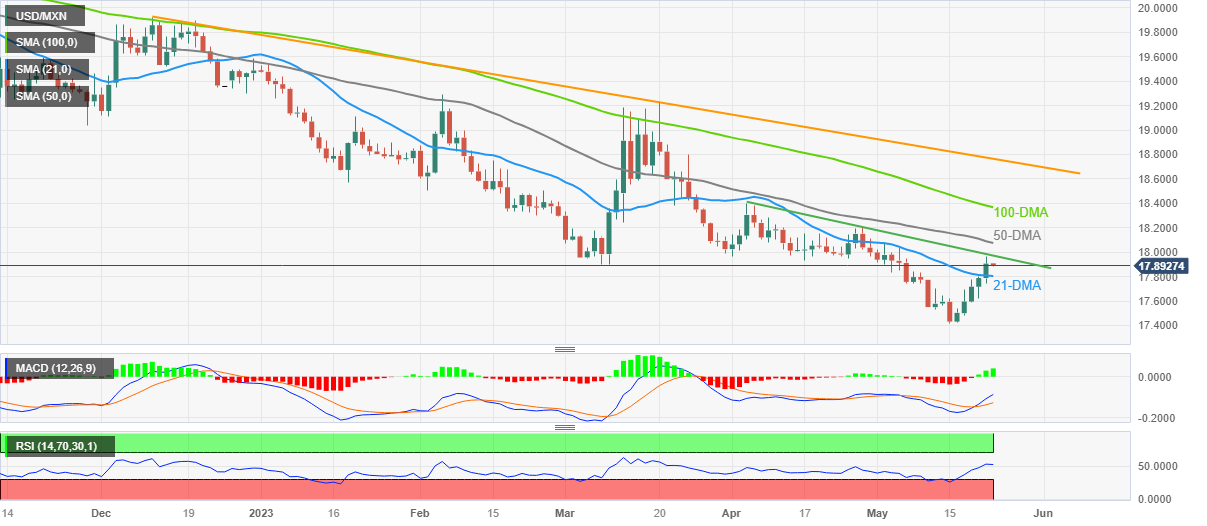
Trend: Further upside expected
Information on these pages contains forward-looking statements that involve risks and uncertainties. Markets and instruments profiled on this page are for informational purposes only and should not in any way come across as a recommendation to buy or sell in these assets. You should do your own thorough research before making any investment decisions. FXStreet does not in any way guarantee that this information is free from mistakes, errors, or material misstatements. It also does not guarantee that this information is of a timely nature. Investing in Open Markets involves a great deal of risk, including the loss of all or a portion of your investment, as well as emotional distress. All risks, losses and costs associated with investing, including total loss of principal, are your responsibility. The views and opinions expressed in this article are those of the authors and do not necessarily reflect the official policy or position of FXStreet nor its advertisers.