USD/MXN Price Analysis: Mexican Peso rebound needs validation from 16.87 and US NFP
|
- USD/MXN pares the biggest daily gain in a month but lacks downside momentum of late.
- Clear upside break of triangle, sustained trading beyond the key SMA confluence favors Mexican Peso sellers.
- Overbought RSI prods USD/MXN buyers ahead of US NFP.
USD/MXN takes offers to refreshe intraday bottom surrounding 16.98, after reversing from the weekly top, as markets brace for the key US employment report for August on Friday.
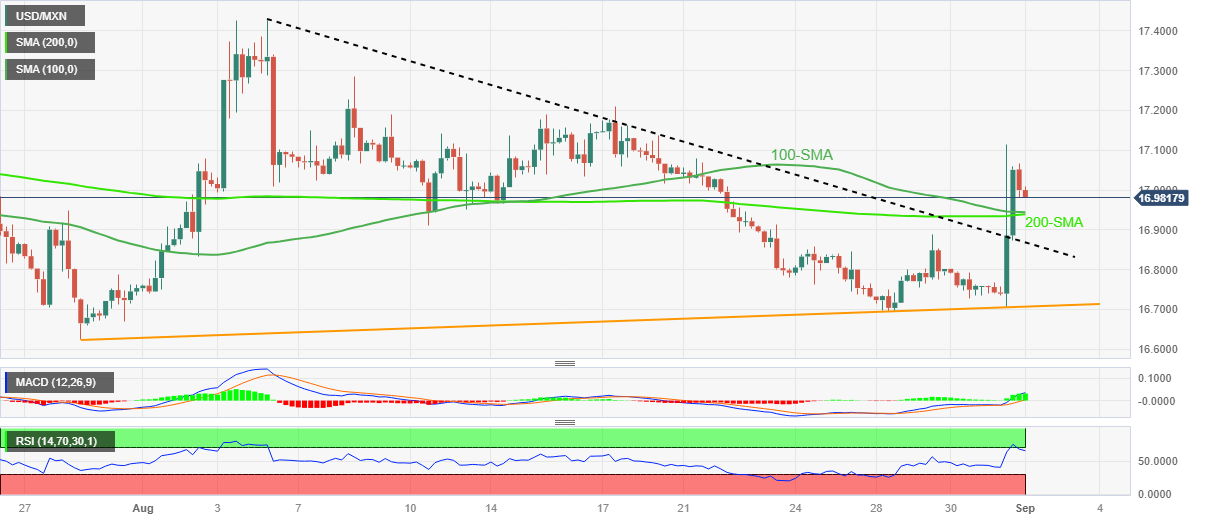
USD/MXN rallied the most in a month while refreshing the weekly top on Thursday after it crossed the top line of a five-week-old symmetrical triangle. The bullish breakout also gained support from the MACD signals to renew the multi-day top. However, the nearly overbought RSI and the pre-data positioning seem to weigh on the Mexican Peso (MXN) pair of late.
Even so, a convergence of the 100-SMA and 200-SMA, around 16.94–93, appears a tough nut to crack for the USD/MXN sellers.
Following that, the stated triangle’s top line surrounding 16.87 will be in the spotlight.
Should the USD/MXN bears keep the reins past 16.87, the odds of witnessing a fall toward the rising support line stretched from late July, near 16.70, can’t be ruled out.
On the contrary, the USD/MXN pair’s recovery needs to refresh the weekly top, currently around 17.11, to convince the buyers.
Even so, the mid-August swing high of 17.20 and the previous monthly peak surrounding 17.42 could test the Mexican Peso (MXN) sellers before giving them control.
USD/MXN: Four-hour chart
Trend: Recovery expected
Information on these pages contains forward-looking statements that involve risks and uncertainties. Markets and instruments profiled on this page are for informational purposes only and should not in any way come across as a recommendation to buy or sell in these assets. You should do your own thorough research before making any investment decisions. FXStreet does not in any way guarantee that this information is free from mistakes, errors, or material misstatements. It also does not guarantee that this information is of a timely nature. Investing in Open Markets involves a great deal of risk, including the loss of all or a portion of your investment, as well as emotional distress. All risks, losses and costs associated with investing, including total loss of principal, are your responsibility. The views and opinions expressed in this article are those of the authors and do not necessarily reflect the official policy or position of FXStreet nor its advertisers.
