USD/MXN Price Analysis: Mexican Peso eases from 16.80 support confluence ahead of Fed Powell’s speech
|
- USD/MXN edges higher after bouncing off the lowest level in three weeks.
- Six-week-old horizontal support zone, previous resistance-line from late May challenge Mexican Peso buyers.
- Bearish MACD signals, downbeat RSI prods pair buyers, convergence of 21-DMA, 50-DMA appear a tough nut to crack.
USD/MXN defends the previous day’s rebound from the lowest level in three weeks while making rounds to 16.82–83 during the early hours of Friday’s Asian session.
In doing so, the Mexican Peso (MXN) pair bounces off the 16.80 support confluence comprising a 1.5-month-long horizontal support area, as well as the resistance-turned-support line stretched from late May.
It’s worth noting, however, that the bearish MACD signals and downbeat RSI (14) line challenge the USD/MXN pair’s latest rebound.
Also acting as the upside filter is the joint of the 21-DMA and 50-DMA, around the 17.00 threshold.
Additionally, the mid-August swing high of around 17.20 and the monthly peak of 17.43 can test the USD/MXN pair buyers past the 17.00 psychological magnet before giving them control.
On the flip side, a daily closing beneath the 16.80 support confluence could quickly fetch the Mexican Peso (MXN) pair towards the Year-To-Date low of around 16.62.
Above all, the USD/MXN rebound appears elusive ahead of the key central bankers’ speeches. Among them, Fed Chair Jerome Powell will gain major attention amid recently mixed US data and concerns about the policy pivot.
Also read:
USD/MXN: Daily chart
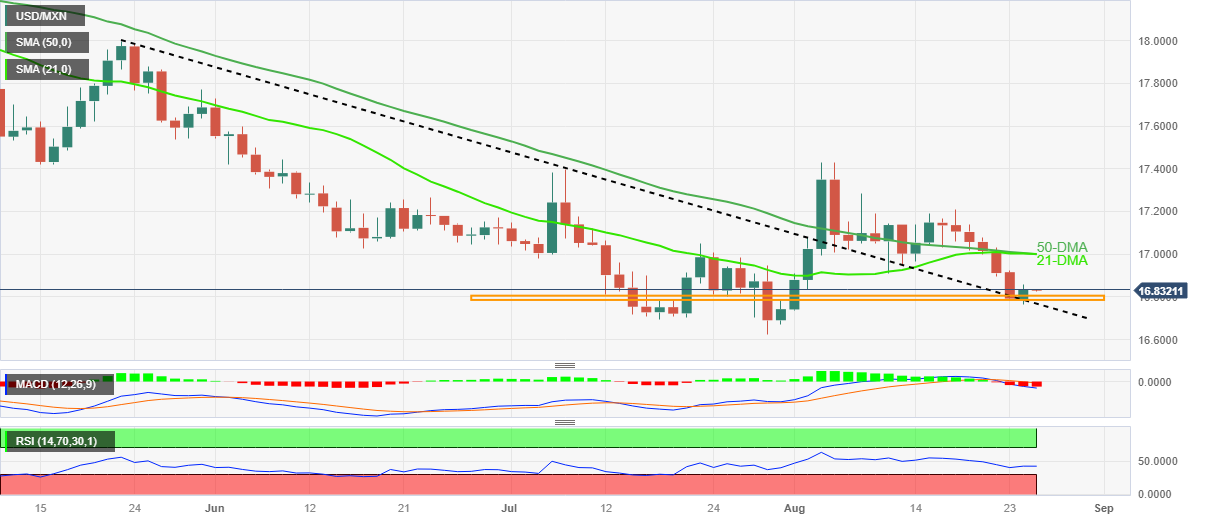
Trend: Limited downside expected
Information on these pages contains forward-looking statements that involve risks and uncertainties. Markets and instruments profiled on this page are for informational purposes only and should not in any way come across as a recommendation to buy or sell in these assets. You should do your own thorough research before making any investment decisions. FXStreet does not in any way guarantee that this information is free from mistakes, errors, or material misstatements. It also does not guarantee that this information is of a timely nature. Investing in Open Markets involves a great deal of risk, including the loss of all or a portion of your investment, as well as emotional distress. All risks, losses and costs associated with investing, including total loss of principal, are your responsibility. The views and opinions expressed in this article are those of the authors and do not necessarily reflect the official policy or position of FXStreet nor its advertisers.