USD/MXN Price Analysis: Hovers near 18.0700 aligned with the barrier at seven-day EMA
|
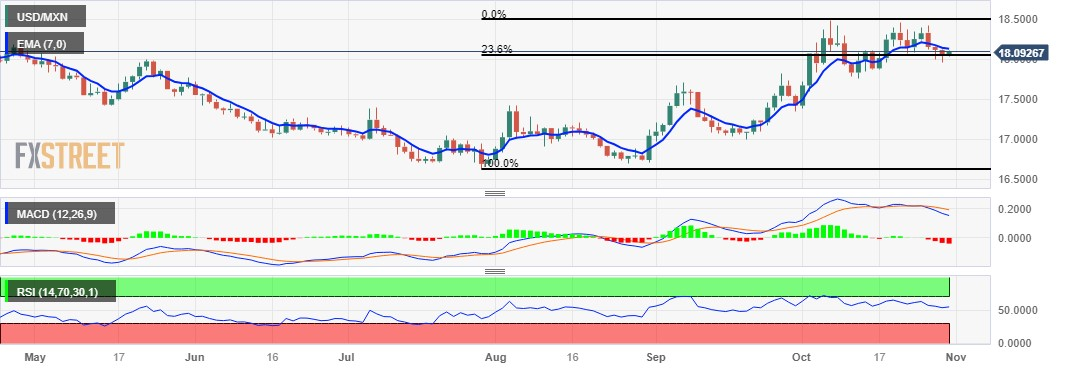
- USD/MXN rebounds after a losing streak.
- MACD line diverges below the signal line, indicating that upward momentum weakens.
- Support at 23.6% Fibonacci retracement aligned with the 18.0000 key level.
USD/MXN snaps a three-day losing streak, trading higher around 18.0700 during the Asian session on Tuesday, followed by the key resistance around the seven-day Exponential Moving Average (EMA) at 18.1310 lined up with the key level at 18.2000.
A firm breakthrough above the barrier could open the doors for the USD/MXN pair to explore the region around the previous week’s low at 18.4257 in sync with the monthly low at 18.4945.
On the downside, the USD/MXN pair could receive support around the 23.6% Fibonacci retracement at 18.0526 lined up with the 18.0000 major level, followed by the weekly high at 17.9749.
The Moving Average Convergence Divergence (MACD) line remains above the centerline but diverges below the signal line, suggesting a potential shift in momentum. This divergence indicates that the recent upward momentum may be slowing down.
The 14-day Relative Strength Index (RSI) lies above the 50 level, indicating a bullish momentum in the market. This suggests that the recent gains in the USD/MXN pair have been stronger and the pair is overbought, implying strength in the current trend.
USD/MXN: Daily Chart
Information on these pages contains forward-looking statements that involve risks and uncertainties. Markets and instruments profiled on this page are for informational purposes only and should not in any way come across as a recommendation to buy or sell in these assets. You should do your own thorough research before making any investment decisions. FXStreet does not in any way guarantee that this information is free from mistakes, errors, or material misstatements. It also does not guarantee that this information is of a timely nature. Investing in Open Markets involves a great deal of risk, including the loss of all or a portion of your investment, as well as emotional distress. All risks, losses and costs associated with investing, including total loss of principal, are your responsibility. The views and opinions expressed in this article are those of the authors and do not necessarily reflect the official policy or position of FXStreet nor its advertisers.