USD/MXN Price Analysis: Bears need acceptance from 18.15 support confluence
|
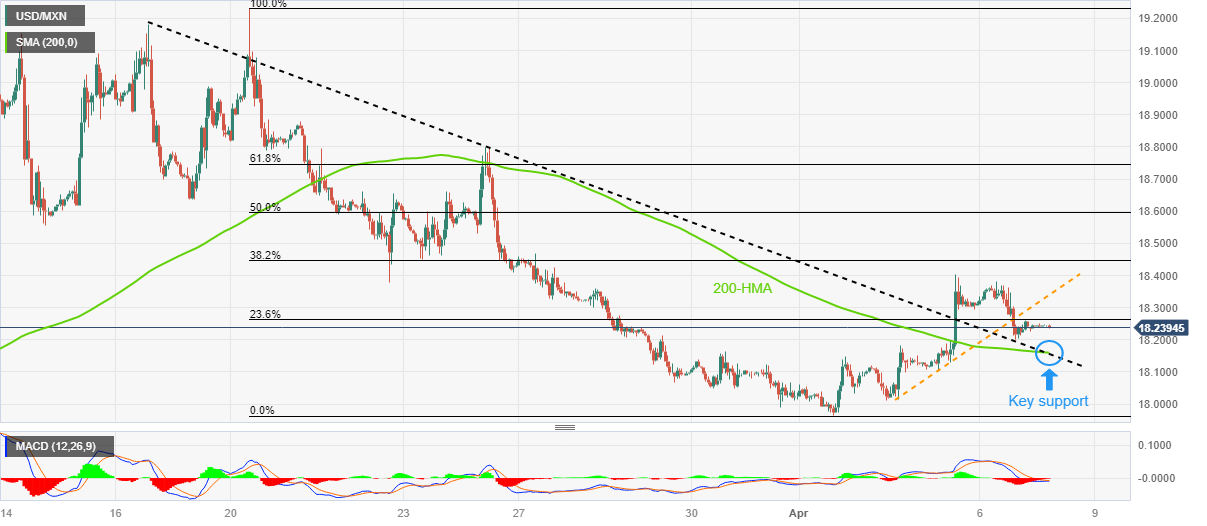
- USD/MXN remains sidelined after snapping three-day uptrend the previous day.
- Convergence of 200-HMA, three-week-old previous resistance line puts a floor under Mexican Peso pair’s price.
- Hesitance in extending trend line break, looming bull cross on MACD lures buyers; recovery remains elusive below 18.40.
USD/MXN pair treads water around 18.23 during a sluggish start of the Good Friday holidays in major bourses. In doing so, the Mexican Peso (MXN) pair struggles to extend the previous day’s downside break of an upward-sloping trend line stretched from Tuesday.
Not only the USD/MXN pair’s resistance in extending the trend line break but an impending bull cross on the MACD indicator also challenge the sellers.
Furthermore, the 200-HMA and resistance-turned-support line from mid-March, around 18.15 by the press time, acts as a tough nut to crack for the USD/MXN bears.
In a case where the pair drops below 18.15, the odds of witnessing a fresh Year-To-Date (YTD) low, currently around 17.96, can’t be ruled out.
Meanwhile, USD/MXN recovery should initially cross the three-day-old previous support line, around 18.35 at the latest, to restore intraday buyer’s confidence.
Even so, the weekly top surrounding 18.40 can act as an extra filter towards the north before giving control to the bulls.
Following that, multiple levels near the 38.2% Fibonacci retracement of the pair’s fall from March 20 to April 03, around 18.45, can entertain the USD/MXN bulls before directing them to 18.80 and then to the 19.00 psychological magnet.
Overall, USD/MXN is yet to break the 18.15 support to convince bears. Until then, the hopes of witnessing a recovery remain on the table.
USD/MXN: Hourly chart
Trend: Recovery expected
Information on these pages contains forward-looking statements that involve risks and uncertainties. Markets and instruments profiled on this page are for informational purposes only and should not in any way come across as a recommendation to buy or sell in these assets. You should do your own thorough research before making any investment decisions. FXStreet does not in any way guarantee that this information is free from mistakes, errors, or material misstatements. It also does not guarantee that this information is of a timely nature. Investing in Open Markets involves a great deal of risk, including the loss of all or a portion of your investment, as well as emotional distress. All risks, losses and costs associated with investing, including total loss of principal, are your responsibility. The views and opinions expressed in this article are those of the authors and do not necessarily reflect the official policy or position of FXStreet nor its advertisers.