USD/JPY surges to a 3-day high on sluggish US Nonfarm Payrolls report
|
- USD/JPY climbed on an initial reaction to the US Nonfarm Payrolls headline.
- The US economy added fewer jobs than forecasts in March, but the US Dollar advanced.
- The Unemployment Rate remained steady while Average Hourly Earnings dipped.
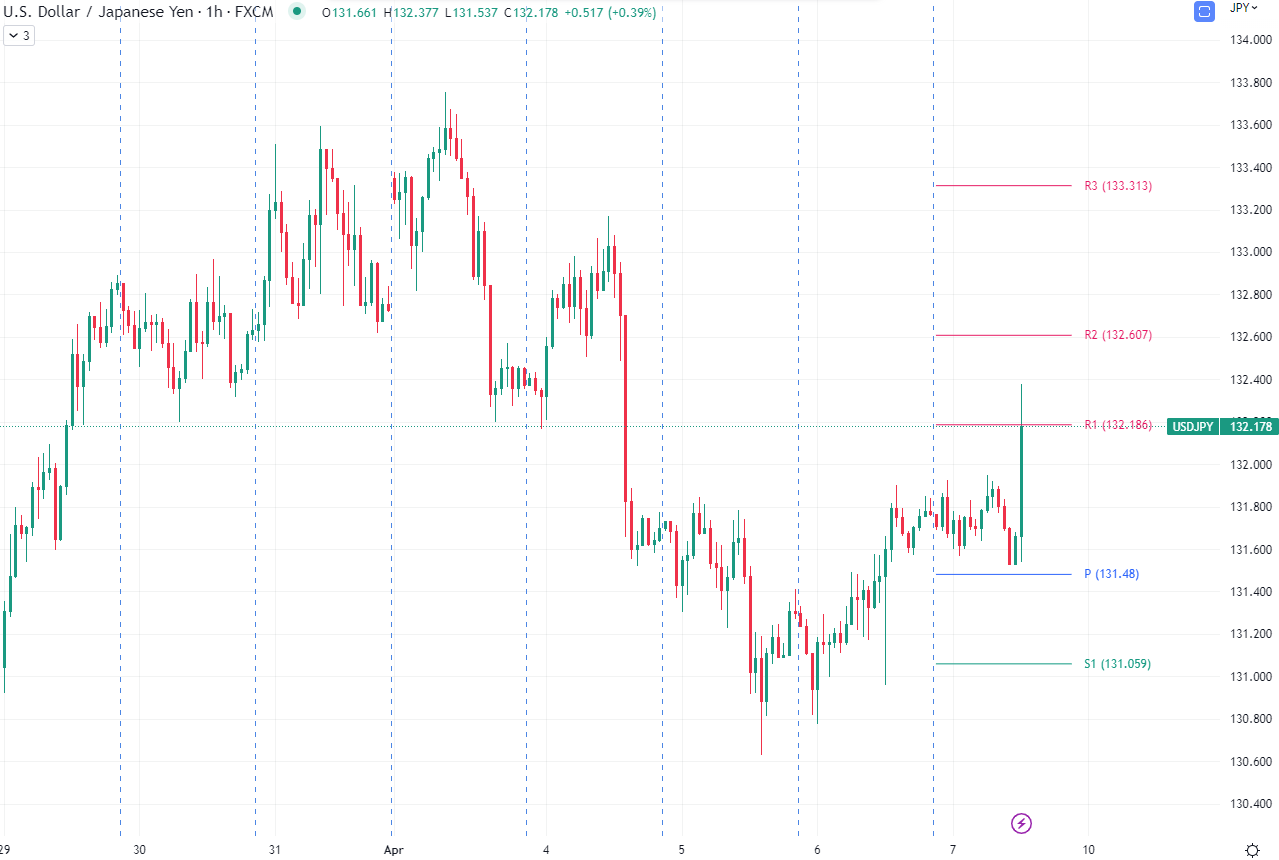
The USD/JPY is rising sharply after the US Nonfarm Payrolls report showed that the labor market continued to slow down but was a whisker below expectations. At the time of writing, the USD/JPY trades in a wide range of 131.53-132.40, above its opening price.
US Nonfarm Payrolls missed estimates, but the US Dollar strengthens
The US Bureau of Labor Statistics (BLS) data showed that employment in March decelerated to 236K, below the 240K expected by the street, and trailed 311K jobs added in February. Average Hourly Earnings came at 4.2% YoY, below expectations of 4.3%, while the Unemployment Rate was 3.4% YoY, 0.2% below the 3.6% foreseen.
USD/JPY 1-Hour Chart Reaction
The USD/JPY jumped from around 131.50, a tick above the central daily pivot point at 131.48, and broke above the previous three-day high of 131.93, and did not look back on the reaction to the headline. On its way north, the USD/JPY cleared the R1 daily pivot point at 132.18 but fell short of testing the R2 pivot at 132.60. A clear breach of the latter, and the USD/JPY could test April 4 133.16 daily high before challenging the R3 pivot at 133.31. On the flip side, a fall below 132.00 will expose the daily pivot at 131.48, followed by the S1 pivot at 131.06.
Information on these pages contains forward-looking statements that involve risks and uncertainties. Markets and instruments profiled on this page are for informational purposes only and should not in any way come across as a recommendation to buy or sell in these assets. You should do your own thorough research before making any investment decisions. FXStreet does not in any way guarantee that this information is free from mistakes, errors, or material misstatements. It also does not guarantee that this information is of a timely nature. Investing in Open Markets involves a great deal of risk, including the loss of all or a portion of your investment, as well as emotional distress. All risks, losses and costs associated with investing, including total loss of principal, are your responsibility. The views and opinions expressed in this article are those of the authors and do not necessarily reflect the official policy or position of FXStreet nor its advertisers.
