USD/JPY Price Forecast: Dragonfly doji looms, bulls target 141.00
|
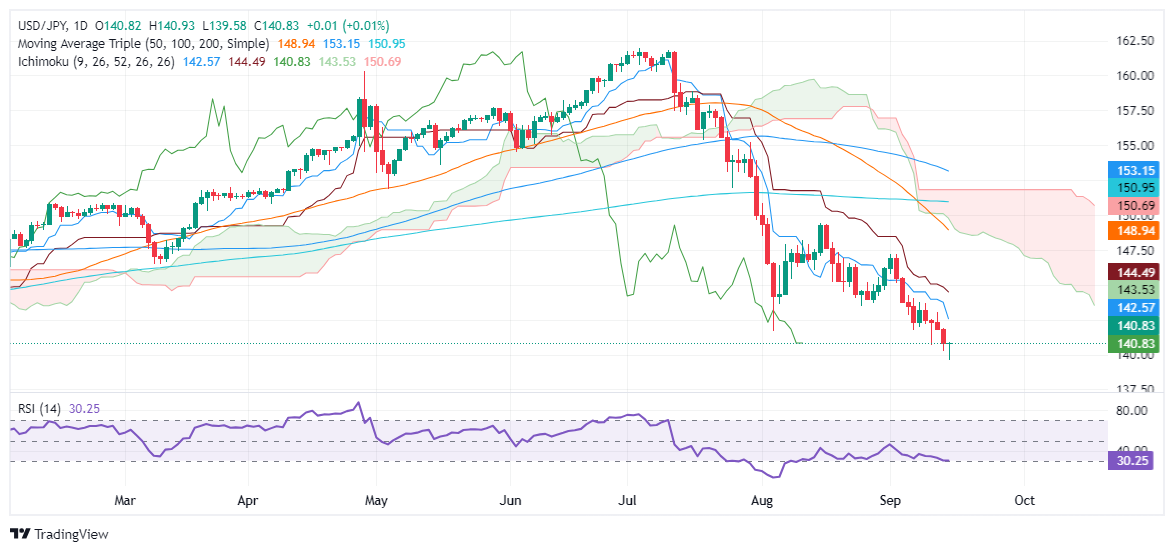
- USD/JPY recovers after diving to a YTD low; a daily close above 140.25 paves the way for further upside.
- Key resistance levels include 142.57 (Tenkan-Sen), 143.52 (Senkou Span A), and 144.48 (Kijun-Sen).
- Momentum remains bearish, but bullish patterns like a ‘dragonfly doji’ or ‘hammer’ could signal a leg higher if confirmed.
The USD/JPY recovers some ground late in the North American session after touching a new year-to-date (YTD) low of 139.58 earlier in the day. At the time of writing, the major pair traded at 140.85 and registered minimal gains of 0.03%.
USD/JPY Price Forecast: Technical outlook
The downtrend would likely continue after clearing December’s 28 low of 140.25, but USD/JPY buyers bought the dip, clearing the latter as the pair aims towards 141.00.
A daily close above 140.25 would open the way to testing key resistance levels amid a busy week of monetary policy decisions from the Federal Reserve and the Bank of Japan.
Momentum hints that sellers remain in control, as shown by the Relative Strength Index (RSI). But if Monday’s price action completes a ‘dragon-fly doji’ or a ‘hammer,’ look for a leg up.
On further strength, USD/JPY's first resistance would be the Tenkan-Sen at 142.57, followed by the Senkou Span A at 143.52. If those levels are cleared, buyers can aim for the Kijun-Sen at 144.48.
Conversely, if sellers drag prices below 140.25, that can pave the way for further downside.
USD/JPY Price Action – Daily Chart
Japanese Yen PRICE Today
The table below shows the percentage change of Japanese Yen (JPY) against listed major currencies today. Japanese Yen was the strongest against the US Dollar.
| USD | EUR | GBP | JPY | CAD | AUD | NZD | CHF | |
|---|---|---|---|---|---|---|---|---|
| USD | -0.44% | -0.65% | 0.06% | -0.05% | -0.64% | -0.49% | -0.25% | |
| EUR | 0.44% | -0.27% | 0.44% | 0.36% | -0.26% | -0.11% | 0.15% | |
| GBP | 0.65% | 0.27% | 0.65% | 0.62% | 0.00% | 0.17% | 0.42% | |
| JPY | -0.06% | -0.44% | -0.65% | -0.10% | -0.63% | -0.51% | -0.36% | |
| CAD | 0.05% | -0.36% | -0.62% | 0.10% | -0.67% | -0.44% | -0.31% | |
| AUD | 0.64% | 0.26% | -0.00% | 0.63% | 0.67% | 0.16% | 0.40% | |
| NZD | 0.49% | 0.11% | -0.17% | 0.51% | 0.44% | -0.16% | 0.25% | |
| CHF | 0.25% | -0.15% | -0.42% | 0.36% | 0.31% | -0.40% | -0.25% |
The heat map shows percentage changes of major currencies against each other. The base currency is picked from the left column, while the quote currency is picked from the top row. For example, if you pick the Japanese Yen from the left column and move along the horizontal line to the US Dollar, the percentage change displayed in the box will represent JPY (base)/USD (quote).
Information on these pages contains forward-looking statements that involve risks and uncertainties. Markets and instruments profiled on this page are for informational purposes only and should not in any way come across as a recommendation to buy or sell in these assets. You should do your own thorough research before making any investment decisions. FXStreet does not in any way guarantee that this information is free from mistakes, errors, or material misstatements. It also does not guarantee that this information is of a timely nature. Investing in Open Markets involves a great deal of risk, including the loss of all or a portion of your investment, as well as emotional distress. All risks, losses and costs associated with investing, including total loss of principal, are your responsibility. The views and opinions expressed in this article are those of the authors and do not necessarily reflect the official policy or position of FXStreet nor its advertisers.