USD/JPY Price Analysis: Sinks to five-month lows fueled by reignited US recession fears
|
- USD/JPY falls to 146.41, lowest since March, amid worse-than-expected US economic data.
- Technical outlook: Strong support at 146.48; a close below targets 146.00, 145.50, and 145.00 levels.
- RSI indicates potential for upward correction; resistance at 147.00 and cycle low at 151.86 if buyers regain control.
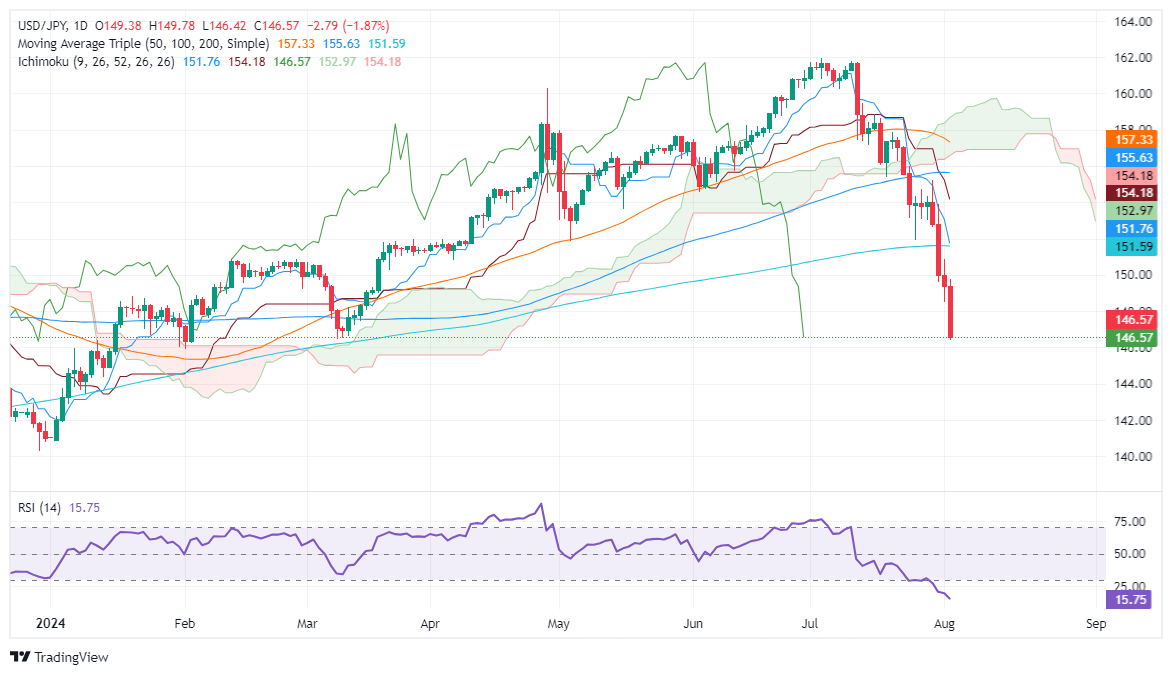
The USD/JPY collapsed to a five-month low of 146.41 on Friday following the release of worse-than-expected US economic data that increased the odds for a Federal Reserve cut at the September meeting. Hence, the US 10-year Treasury bond yield, closely correlated to this pair, tumbled sharply below the 4% threshold, while the major dropped after hitting a daily high of 149.77. At the time of writing, the pair exchanges hands at 146.62, down by more than 1.80%.
USD/JPY Price Analysis: Technical outlook
After clearing key support levels, the USD/JPY is set to test lower prices, though it faces strong support at the March 11 pivot low of 146.48. Sellers will need to push the spot price below the latter so they have the chance to test lower prices.
The Relative Strength Index (RSI) suggests that prices are overextended, which could lead to an upward correction in USD/JPY.
For a bearish continuation, sellers need a daily close below 146.48. Once achieved, the next support would be the 146.00 figure, followed by the 145.50. A further downside lies at the 145.00 mark
On the other hand, if buyers lift the exchange rate past 147.00, they could threaten to push the spot price above until they can face the latest cycle low turned resistance located at 151.86.
USD/JPY Price Action – Daily Chart
Japanese Yen PRICE Today
The table below shows the percentage change of Japanese Yen (JPY) against listed major currencies today. Japanese Yen was the strongest against the US Dollar.
| USD | EUR | GBP | JPY | CAD | AUD | NZD | CHF | |
|---|---|---|---|---|---|---|---|---|
| USD | -1.14% | -0.56% | -1.88% | -0.10% | -0.27% | -0.28% | -1.62% | |
| EUR | 1.14% | 0.58% | -0.74% | 1.04% | 0.88% | 0.86% | -0.48% | |
| GBP | 0.56% | -0.58% | -1.33% | 0.47% | 0.28% | 0.29% | -1.04% | |
| JPY | 1.88% | 0.74% | 1.33% | 1.83% | 1.64% | 1.62% | 0.28% | |
| CAD | 0.10% | -1.04% | -0.47% | -1.83% | -0.17% | -0.16% | -1.50% | |
| AUD | 0.27% | -0.88% | -0.28% | -1.64% | 0.17% | 0.00% | -1.35% | |
| NZD | 0.28% | -0.86% | -0.29% | -1.62% | 0.16% | -0.01% | -1.32% | |
| CHF | 1.62% | 0.48% | 1.04% | -0.28% | 1.50% | 1.35% | 1.32% |
The heat map shows percentage changes of major currencies against each other. The base currency is picked from the left column, while the quote currency is picked from the top row. For example, if you pick the Japanese Yen from the left column and move along the horizontal line to the US Dollar, the percentage change displayed in the box will represent JPY (base)/USD (quote).
Information on these pages contains forward-looking statements that involve risks and uncertainties. Markets and instruments profiled on this page are for informational purposes only and should not in any way come across as a recommendation to buy or sell in these assets. You should do your own thorough research before making any investment decisions. FXStreet does not in any way guarantee that this information is free from mistakes, errors, or material misstatements. It also does not guarantee that this information is of a timely nature. Investing in Open Markets involves a great deal of risk, including the loss of all or a portion of your investment, as well as emotional distress. All risks, losses and costs associated with investing, including total loss of principal, are your responsibility. The views and opinions expressed in this article are those of the authors and do not necessarily reflect the official policy or position of FXStreet nor its advertisers.