USD/JPY Price Analysis: Gains momentum near 144.00 ahead of US CPI
|
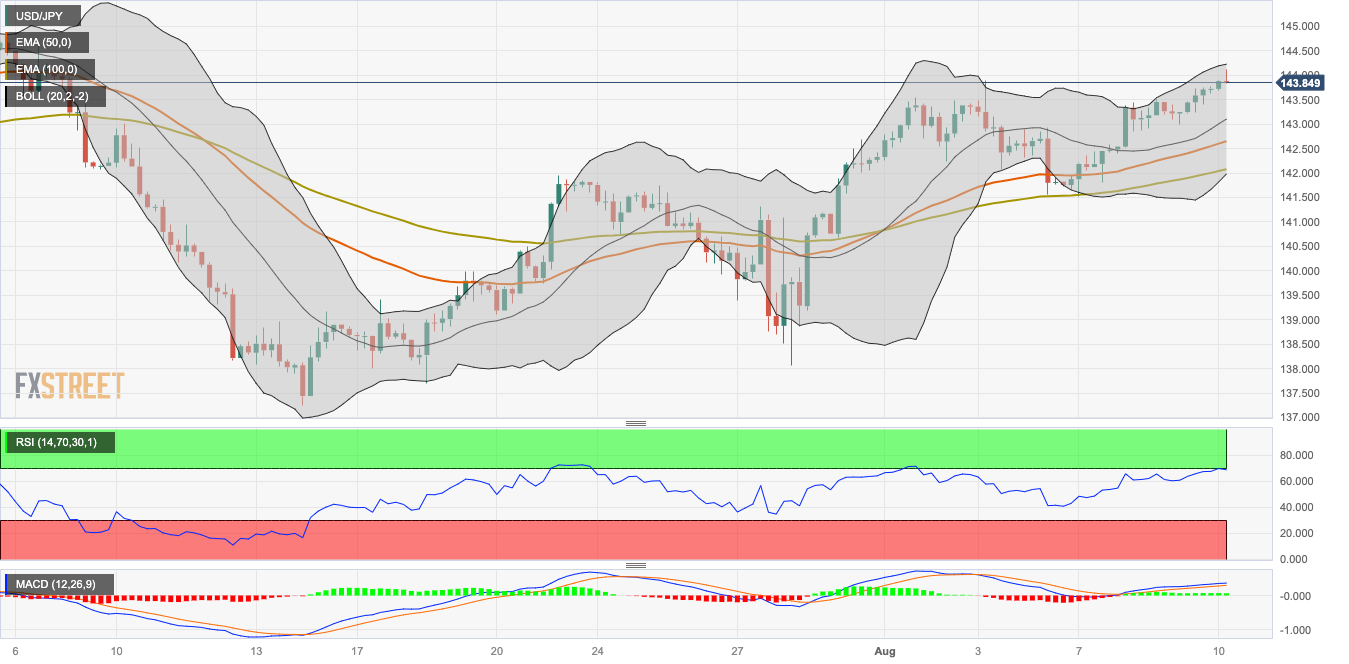
- USD/JPY gains momentum for the fourth consecutive day, just below the 144.00 barrier.
- The pair stands above the 50- and 100-hour EMAs with an upward slope.
- The immediate resistance level is seen at 144.65; the initial support level is located at 143.10.
The USD/JPY pair extends its upside for the fourth consecutive day, heading into an early European session on Thursday. The major pair currently trades around 143.95, gaining 0.15% for the day. Market participants await the US Consumer Price Index (CPI) for July for fresh impetus. The US inflation figure is expected to rise from 3% to 3.3%, and the core figure is expected to remain unchanged at 4.8%.
According to the four-hour chart, the USD/JPY pair stands above the 50- and 100-hour Exponential Moving Averages (EMAs) with an upward slope, which means the path of least resistance is to the upside for the major pair.
Any meaningful follow-through buying beyond 144.25 (the upper boundary of the Bollinger Band) could pave the way to the next hurdle at 144.65 (High July 6). The 144.90–145.00 zone will be a tough nut to crack for the USD/JPY pair. The mentioned level is the confluence of a high of June 30 and a psychological round mark.
On the downside, the immediate support level for USD/JPY is located at 143.10, representing the midline of the Bollinger Band en route to 142.65 (50-hour EMA). The additional downside filter is seen at 142.00 (100-hour EMA and the lower limit of the Bollinger Band), and finally at 141.50 (Low of August 7).
It’s worth noting that the Relative Strength Index (RSI) stands around 70 and Moving Average Convergence/Divergence (MACD) stays in bullish territory, which indicates that the upside momentum has been activated for the time being.
USD/JPY four-hour chart
Information on these pages contains forward-looking statements that involve risks and uncertainties. Markets and instruments profiled on this page are for informational purposes only and should not in any way come across as a recommendation to buy or sell in these assets. You should do your own thorough research before making any investment decisions. FXStreet does not in any way guarantee that this information is free from mistakes, errors, or material misstatements. It also does not guarantee that this information is of a timely nature. Investing in Open Markets involves a great deal of risk, including the loss of all or a portion of your investment, as well as emotional distress. All risks, losses and costs associated with investing, including total loss of principal, are your responsibility. The views and opinions expressed in this article are those of the authors and do not necessarily reflect the official policy or position of FXStreet nor its advertisers.