USD/JPY falls below the 20-day SMA after US PPI, ahead of the Fed
|
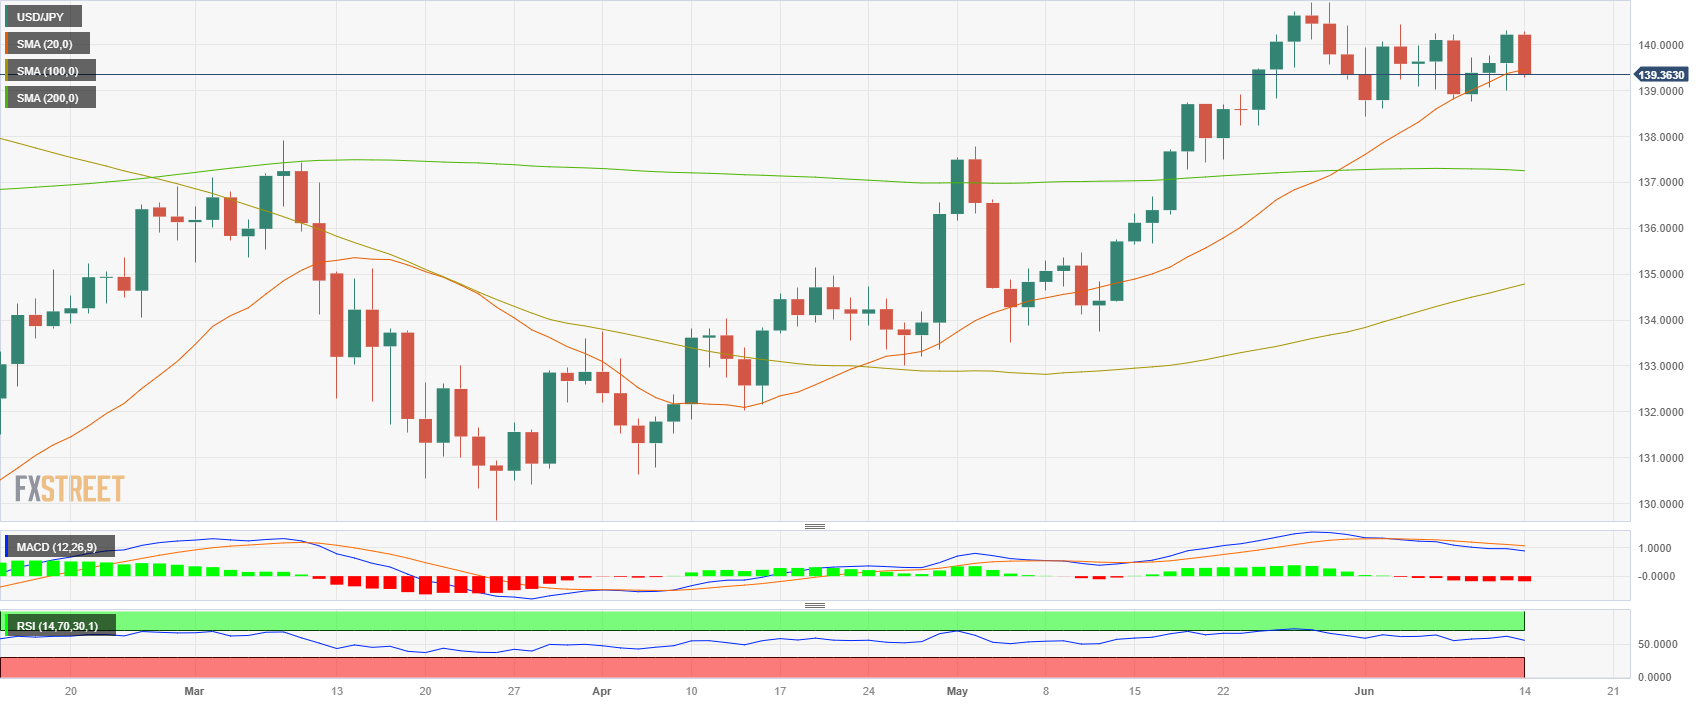
- USD/JPY lost the 20-day SMA at 139.44 and trades at the 139.35 area.
- The US Producer Price Index decreased by 0.3% MoM in May.
- Investors await Fed's decision and revised dot plots.
The USD/JPY lost over 60 pips during the New York session as the Greenback faced severe selling pressure after Producer Price Index (PPI) data from the US showed lower-than-expected ‘factory gate’ inflation. US bond yields are in decline, favoring the JPY, Ahead of the Federal Reserve’s (Fed) decision at 18:00 GMT.
Weak PPI data made US bond yields decline, and stocks rise
The US Bureau of Labor Statistics released on Tuesday the PPI report that showed a decrease of 0.3% MoM in May, more than the 0.1% slide expected; the YoY measure fell to 1.1%. On the other hand, the Core figure rose 0.2% MoM in the same period matching expectations, while the yearly came in at 2.8%.
As a result, the US bond yields have weakened across the curve and applied pressure to the USD. The 10-year bond yield fell to 3.79%, while the 2-year yield sits at 4.62% and the 5-year yield at 3.96%, marking a 1.58% slide, respectively. Elsewhere, the S&P 500 index (SPX) rose to its highest level since April 2022 and applied further pressure to the US Dollar as riskier assets drove away demand from the safe-haven Greenback and the JPY.
Regarding the Fed’s decision, markets continue to discount a no hike, and investors will look for clues regarding forward guidance in the updated macro forecast, the revised dot plots and in Chair Powell’s press conference. As for now, analysts expect that the Fed will resume tightening in the next July meeting, where market participants are expecting a 25 basis point (bps) hike.
USD/JPY Levels to watch
In terms of technical analysis, USD/JPY maintains a neutral stance for the short term as indicators turn red on the daily chart. That being said, the trajectory for the following sessions will be determined by the Fed’s decision and the expectations for future meetings.
After losing the 20-day Simple Moving Average (SMA) at the 139.45 level, support levels for the pair line up at the psychological mark at 139.00 and the 200-day (SMA) at 137.25. Furthermore, a move above the 140.00 zone would suggest a continuation of the bullish trend for USD/JPY, with next resistances at the 140.50 area and a multi-month high at 140.90.

Information on these pages contains forward-looking statements that involve risks and uncertainties. Markets and instruments profiled on this page are for informational purposes only and should not in any way come across as a recommendation to buy or sell in these assets. You should do your own thorough research before making any investment decisions. FXStreet does not in any way guarantee that this information is free from mistakes, errors, or material misstatements. It also does not guarantee that this information is of a timely nature. Investing in Open Markets involves a great deal of risk, including the loss of all or a portion of your investment, as well as emotional distress. All risks, losses and costs associated with investing, including total loss of principal, are your responsibility. The views and opinions expressed in this article are those of the authors and do not necessarily reflect the official policy or position of FXStreet nor its advertisers.